Find stocks moving better than the market.
Start with a scan for relative strength, momentum breakouts, small-cap gappers or growth leaders. Change its filters or build your own. Free data runs 15 minutes behind. Live data is $25 a month.
Loading ZenBot Scanner
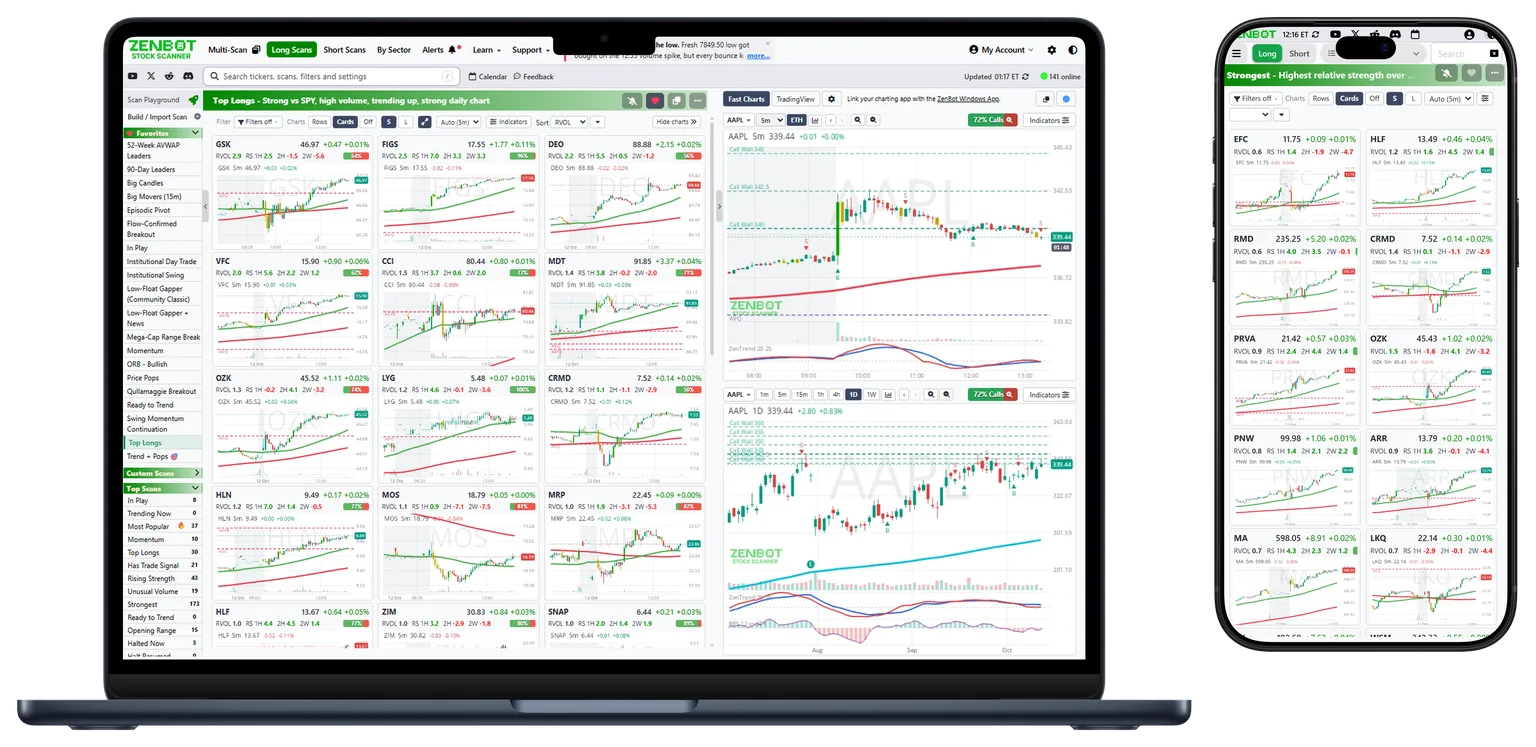
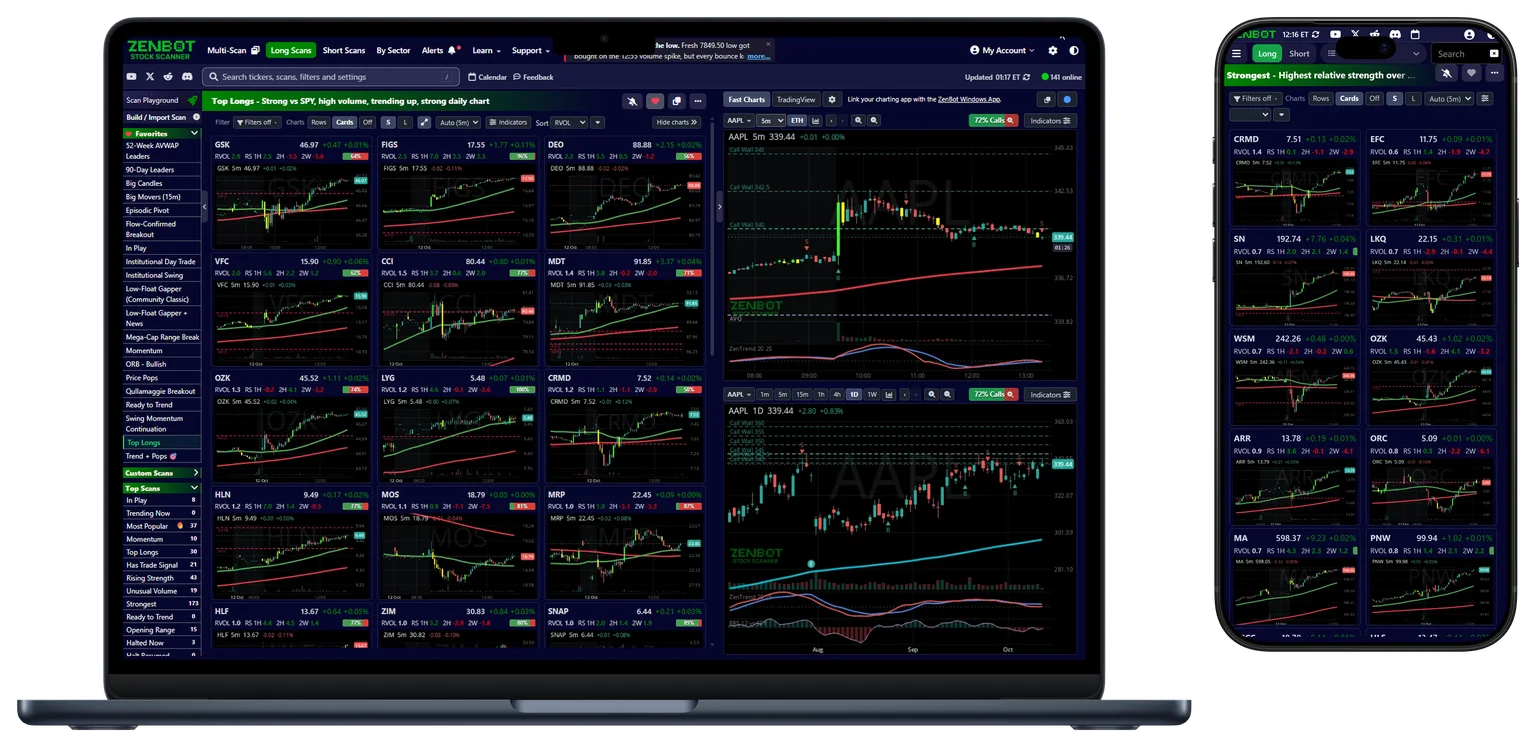
Start with a scan. Check the charts.
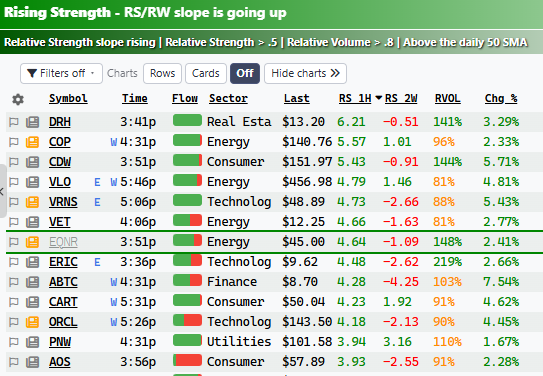
See how a stock moves against SPY
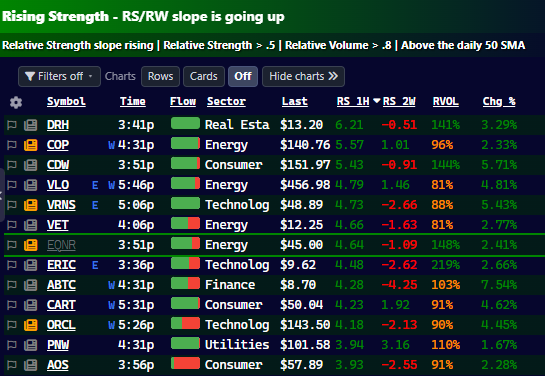
ZenBot compares stocks with SPY and their sector. You can look for strength on the long side or weakness on the short side.
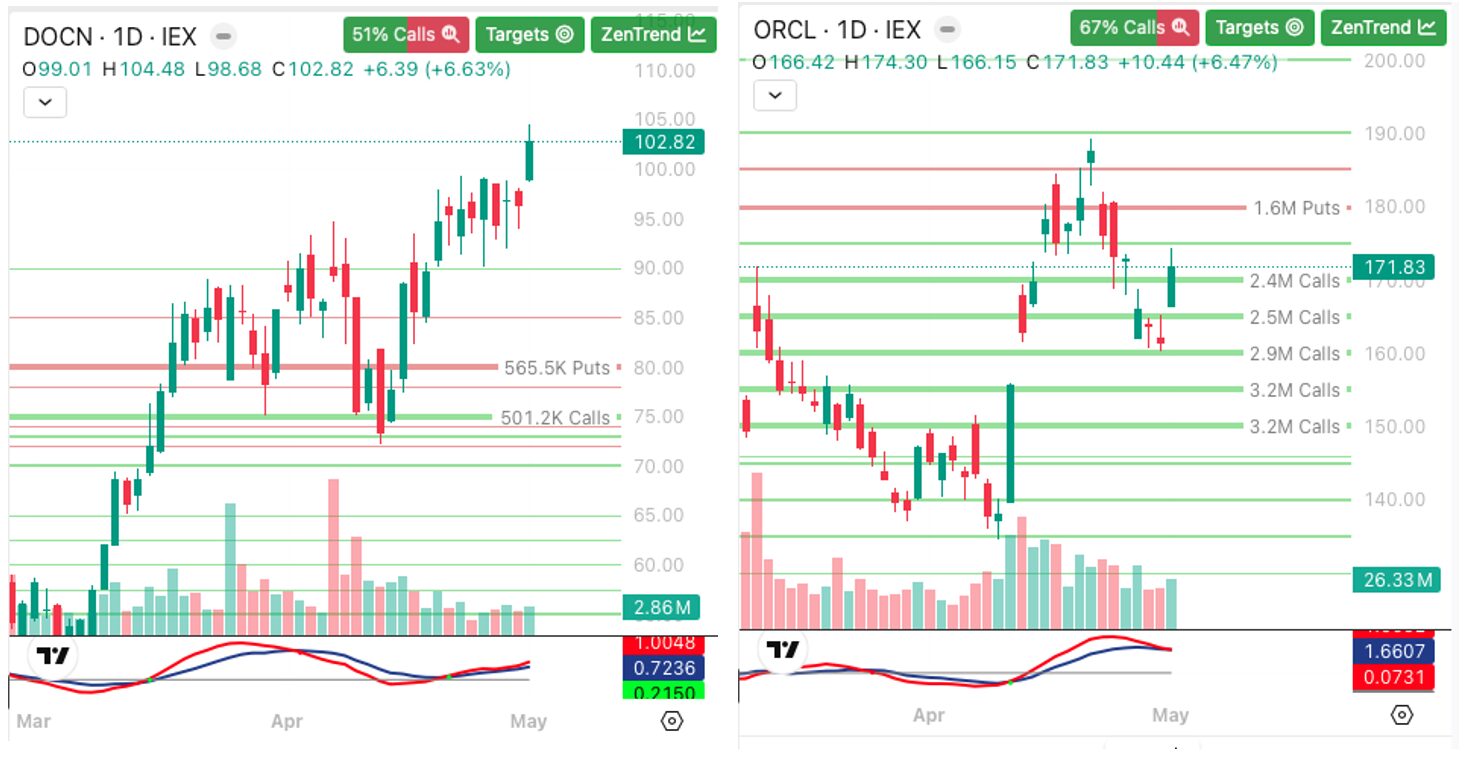
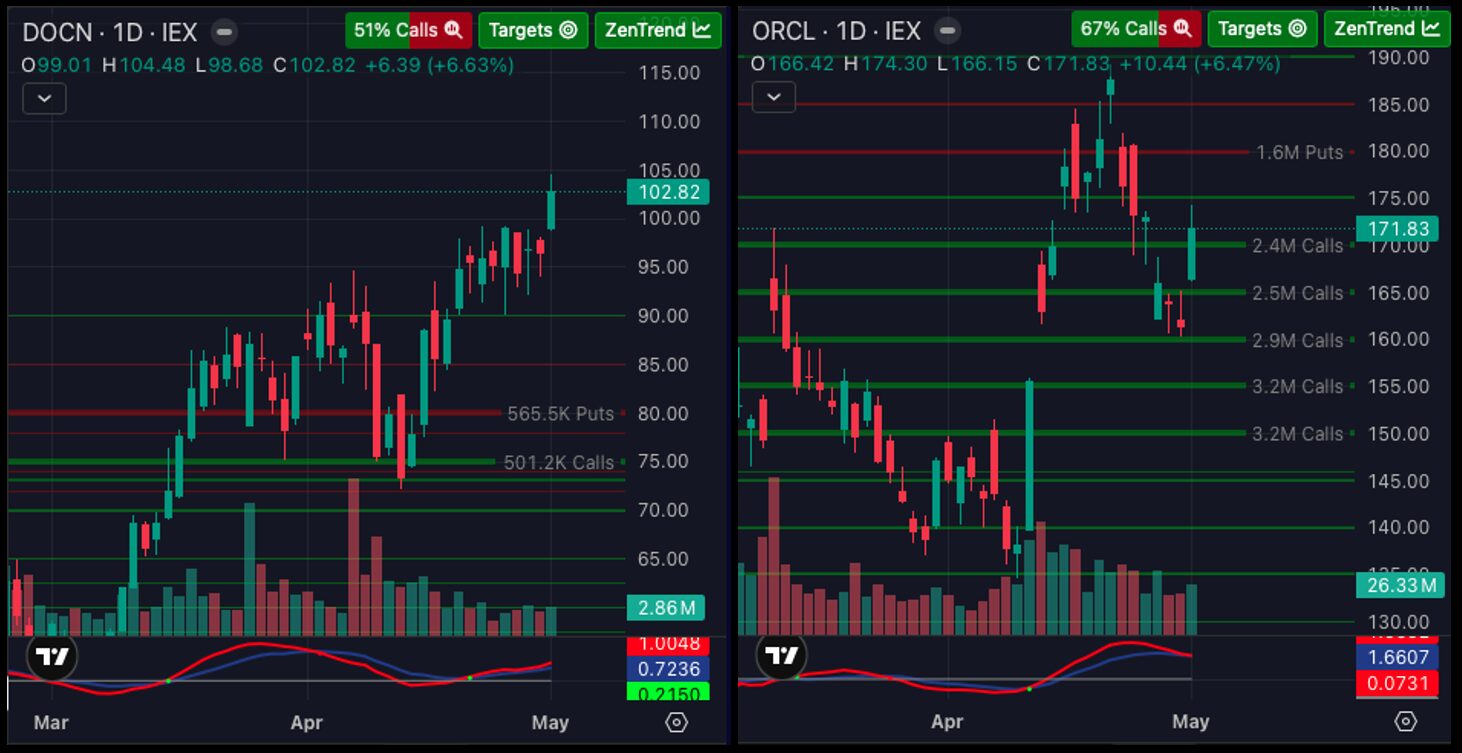
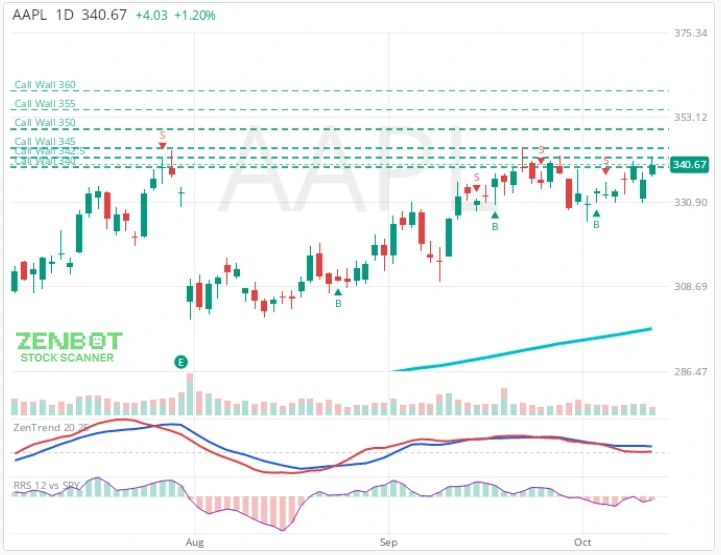
Call and put walls on the chart
See call and put pressure for each ticker, with call walls and put walls drawn on the price chart.
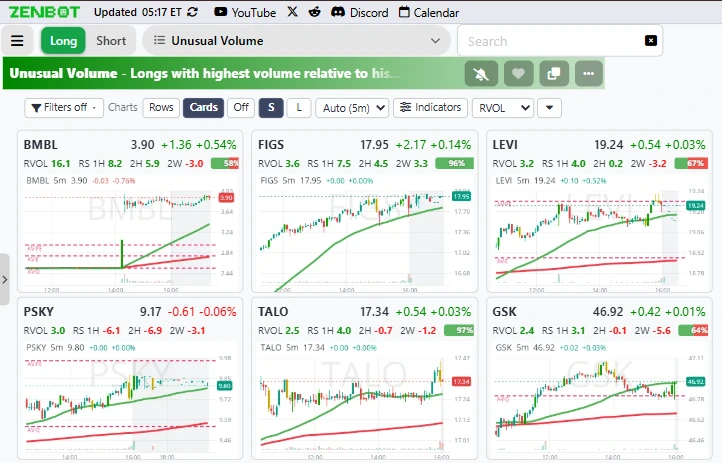
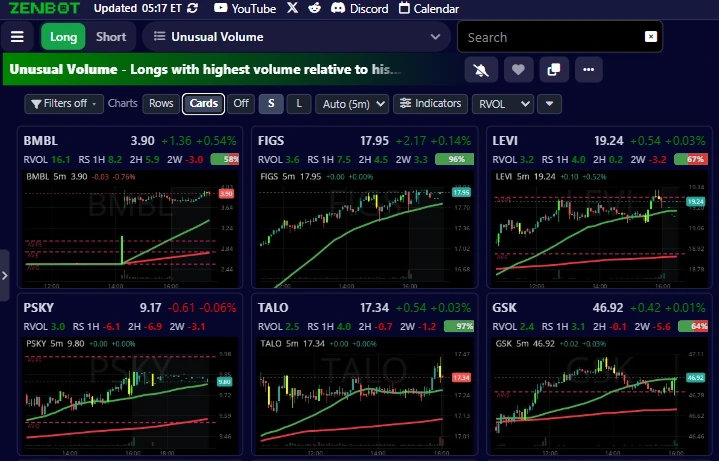
See the whole scan as charts
Switch to Cards and every result has a chart. Personally I collapse the left and right columns and use large previews that stretch full screen.
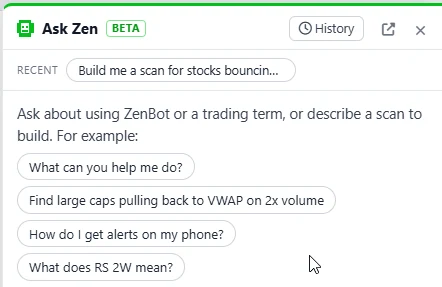
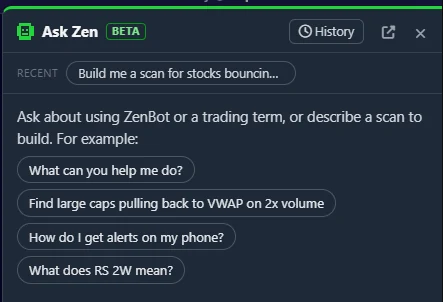
Ask Zen to explain a chart, or build a scan from a description
Describe a scan and Zen builds it. Press Explain Chart and Zen reads the chart. Ask about any stock, the market, or your own scans and alerts.
Fast Charts for working through a scan
Zen draws Fast Charts with options levels, relative strength and ZenTrend. I use them to go through a scan, then TradingView for the two or three names I actually want to trade. TradingView has the drawing tools, indicators and saved layouts for that closer look.
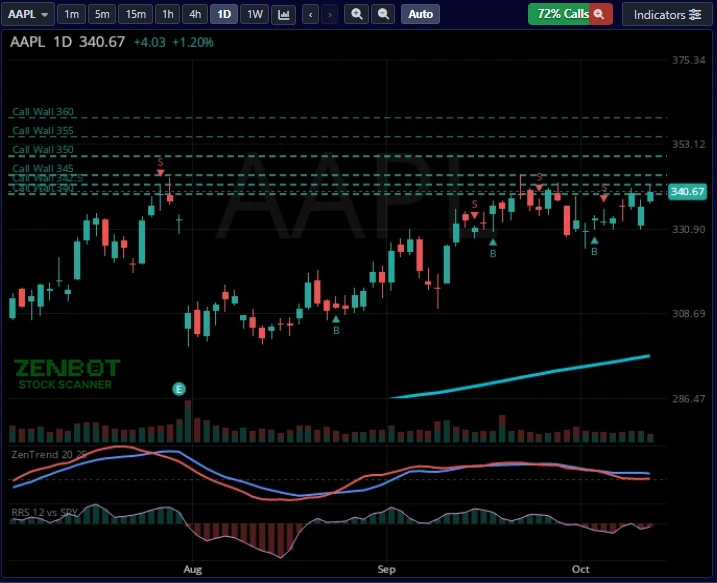
Trade Signals on the chart
Trade Signals mark example entries, stops and targets on the chart. You can scan or filter for recent ones. They're experimental examples, not trade recommendations.
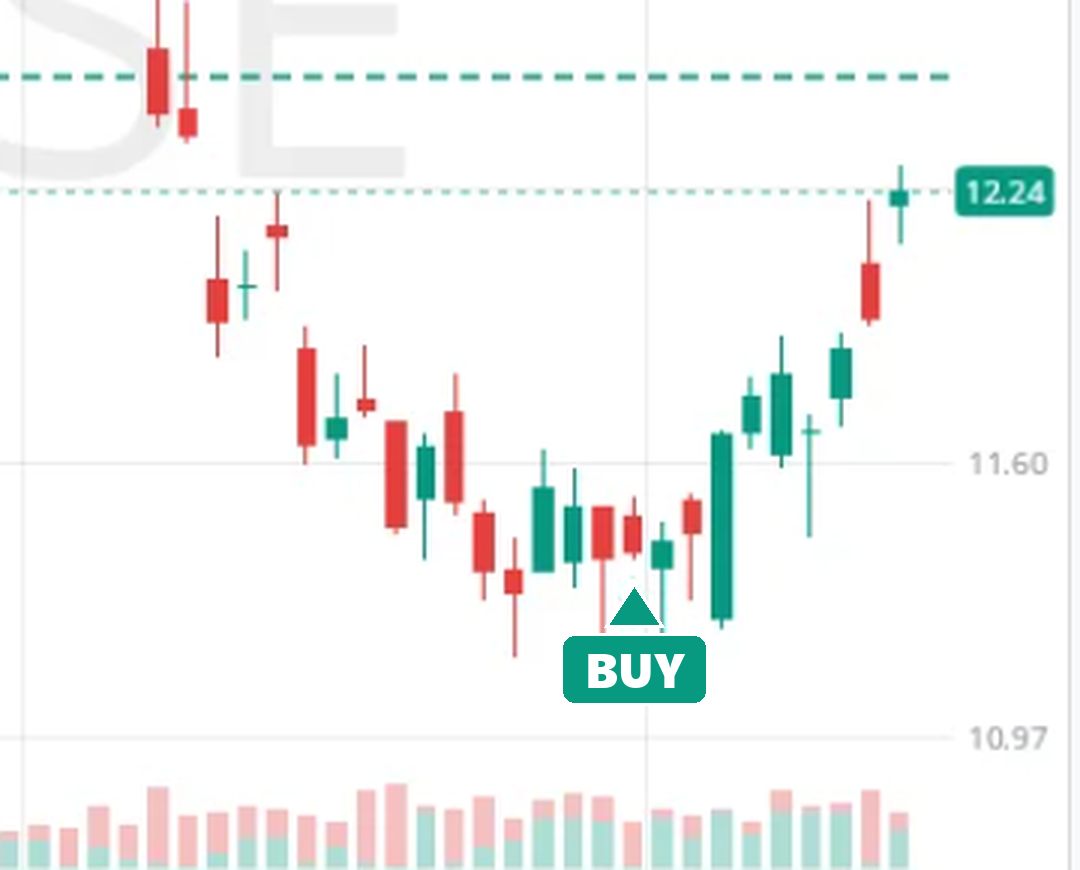
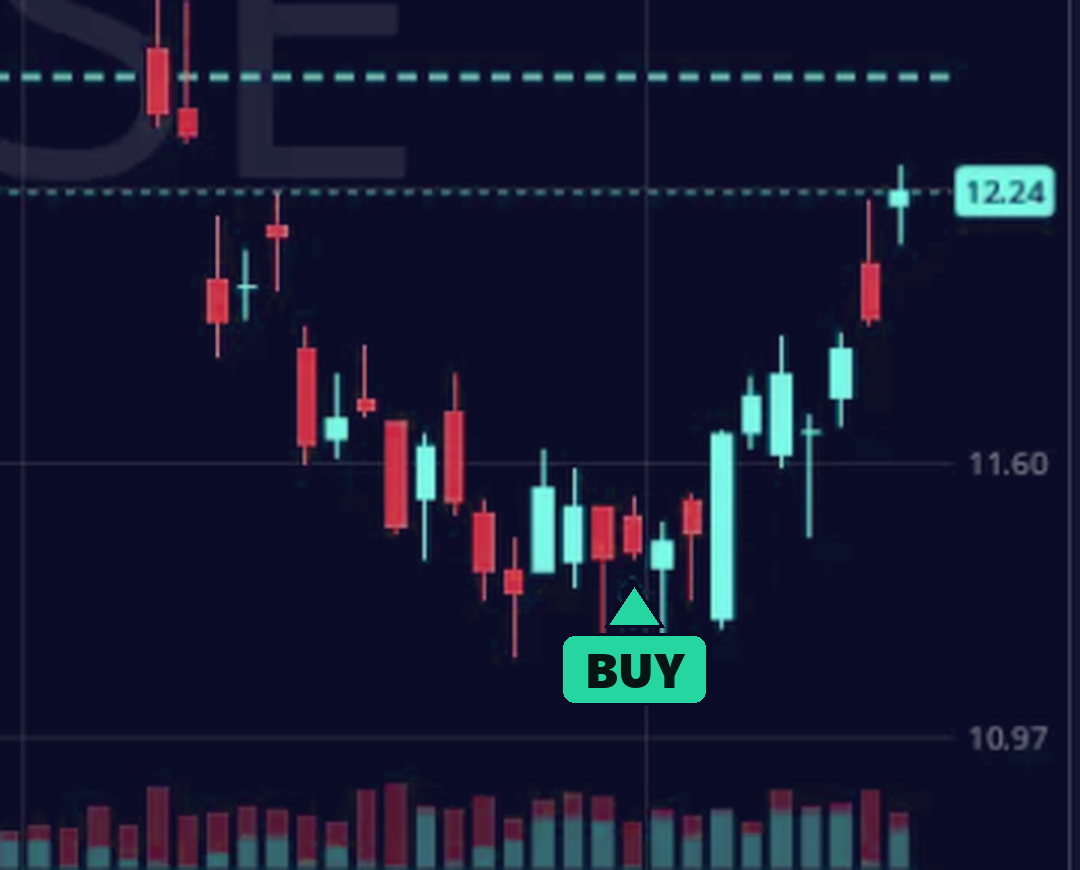
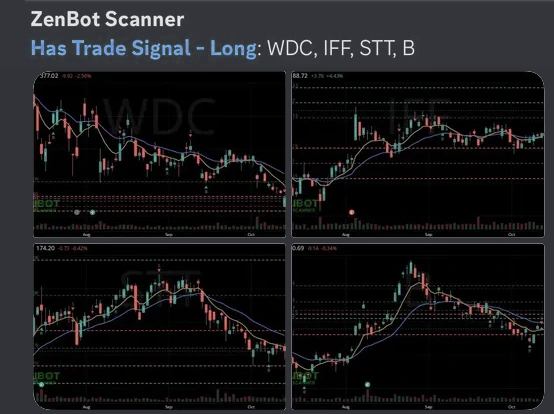
Alerts with a chart
When a stock enters your scan, an alert can reach you in the app, on Telegram or on Discord. Telegram and Discord alerts include a chart.
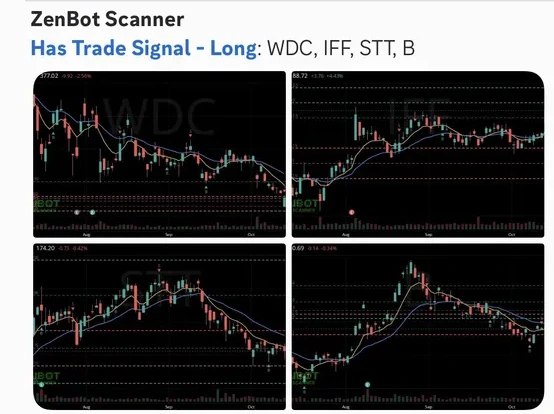
Alerts on any scan
Put an alert on a built-in scan or one you made. New matches appear in Recent Alerts.
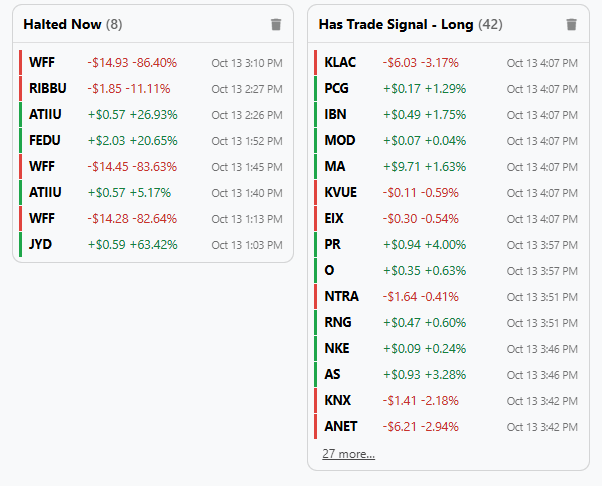
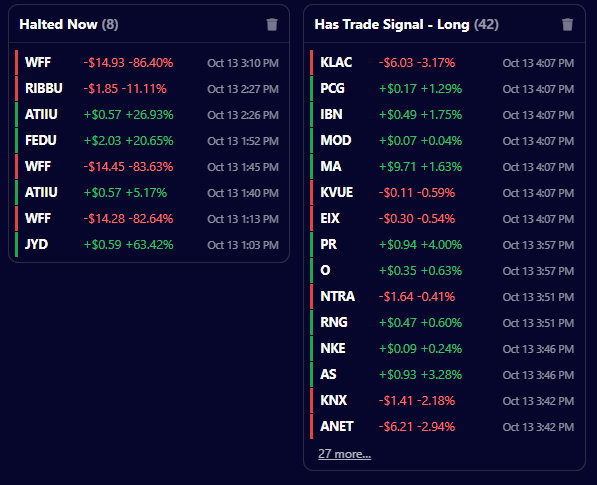
- Live scans as the market moves.
- Live alerts with charts.
- Chart walls with your own indicators.
- No daily chart limit, and up to 20 saved filters.
- Every options price target level.
- Unlimited pop-out windows.
- Copy results or export to CSV.
Build your own scan
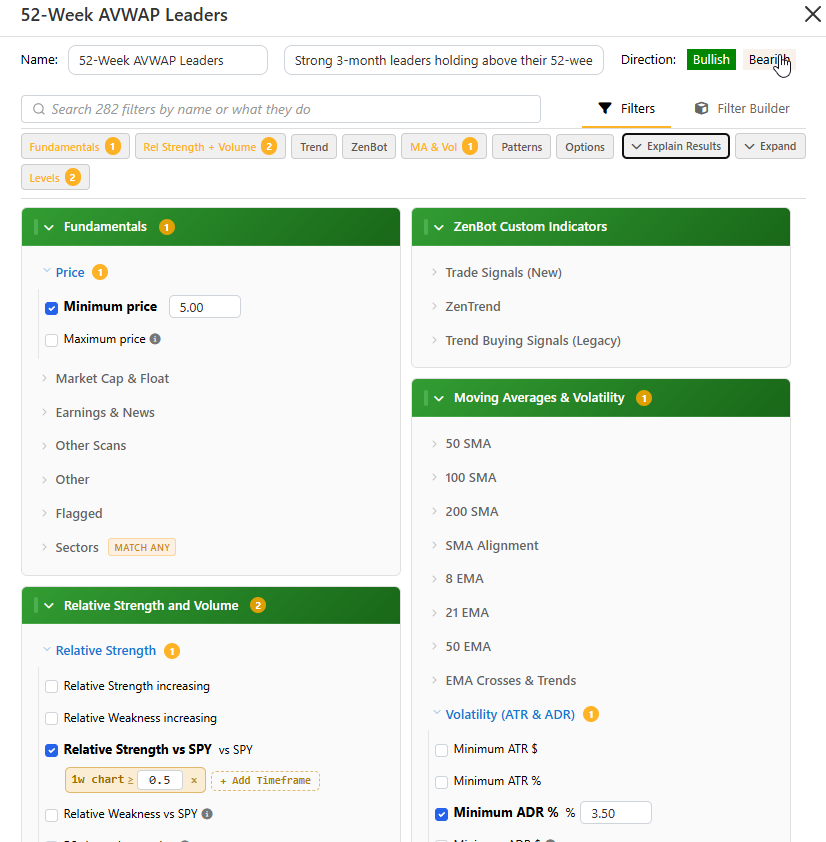
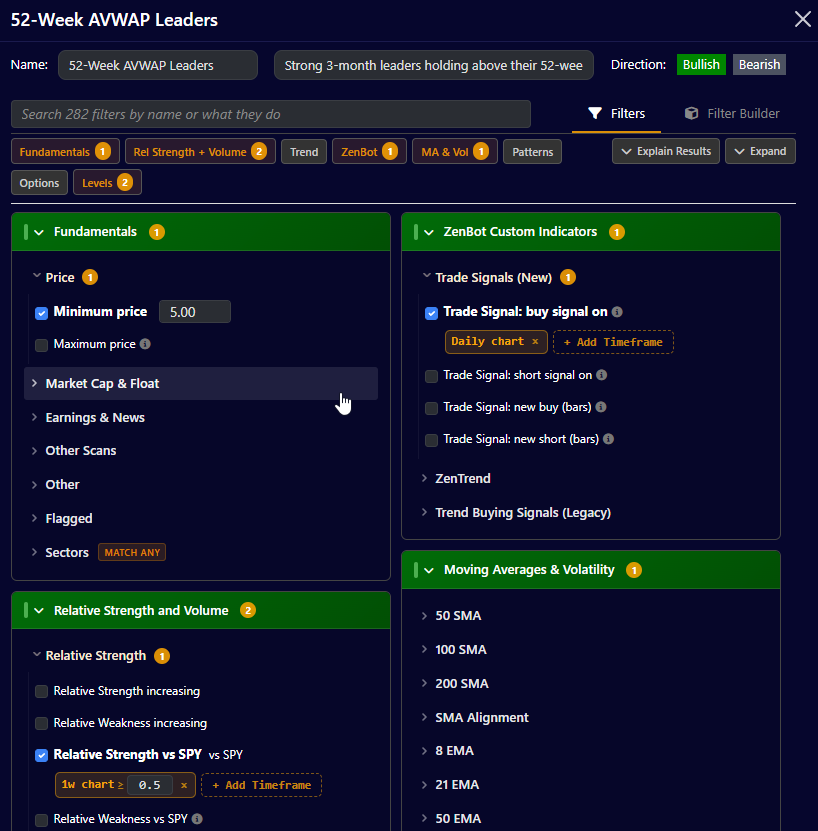
Start with any of 288 filters. Combine them to look for the stocks you care about.
Follow the sectors
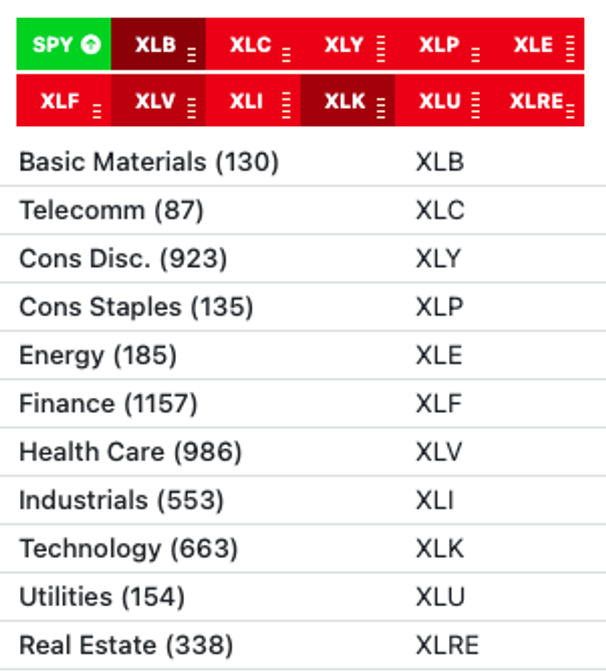
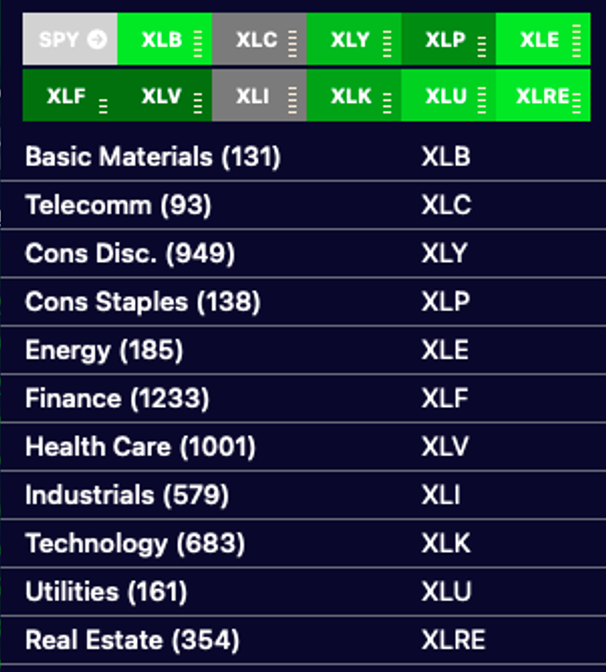
See all 11 sectors ranked by strength and volume, then look at the stocks in each one.
ZenTrend
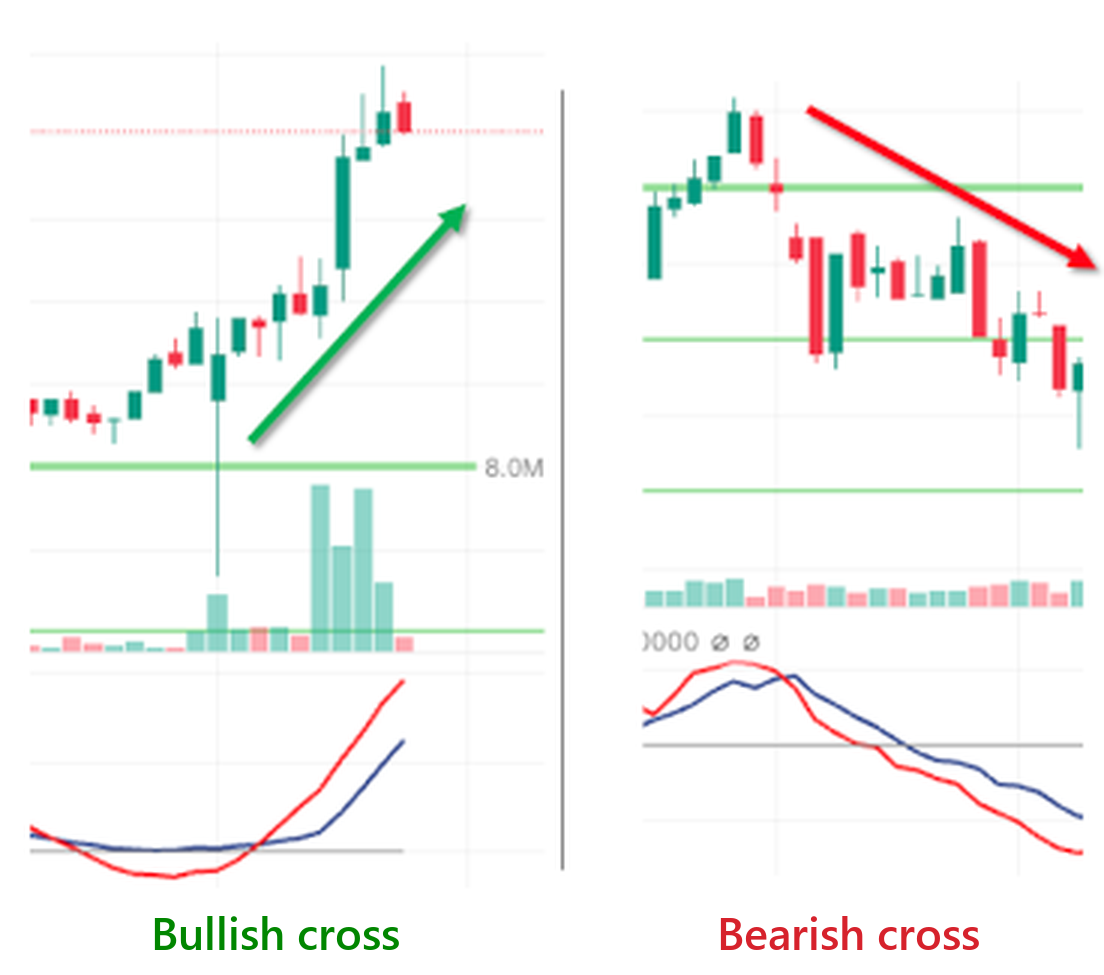
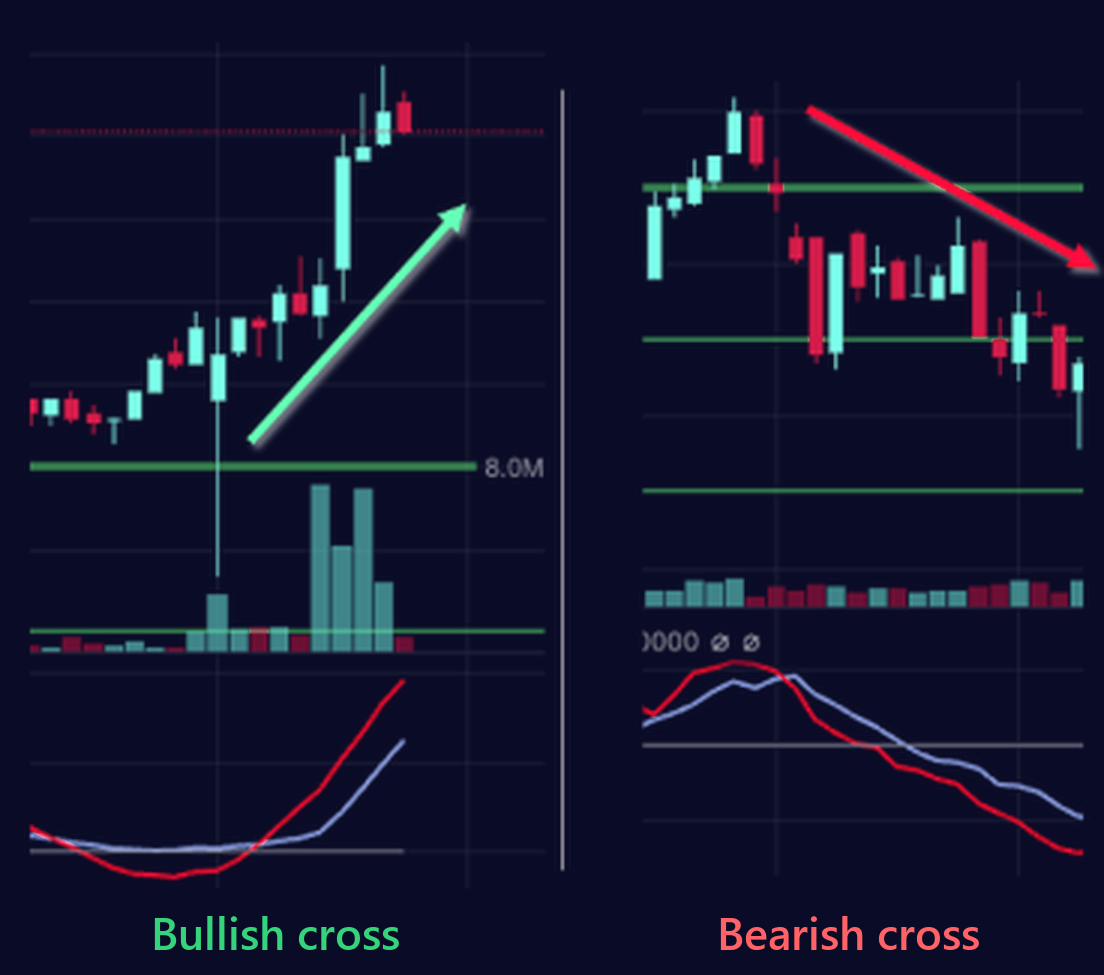
Zen's own trend indicator. It shows where a stock sits in its price cycle, so you can see whether a move is just starting or already stretched before you chase it. Built into every chart, on any timeframe, and the code is open source.
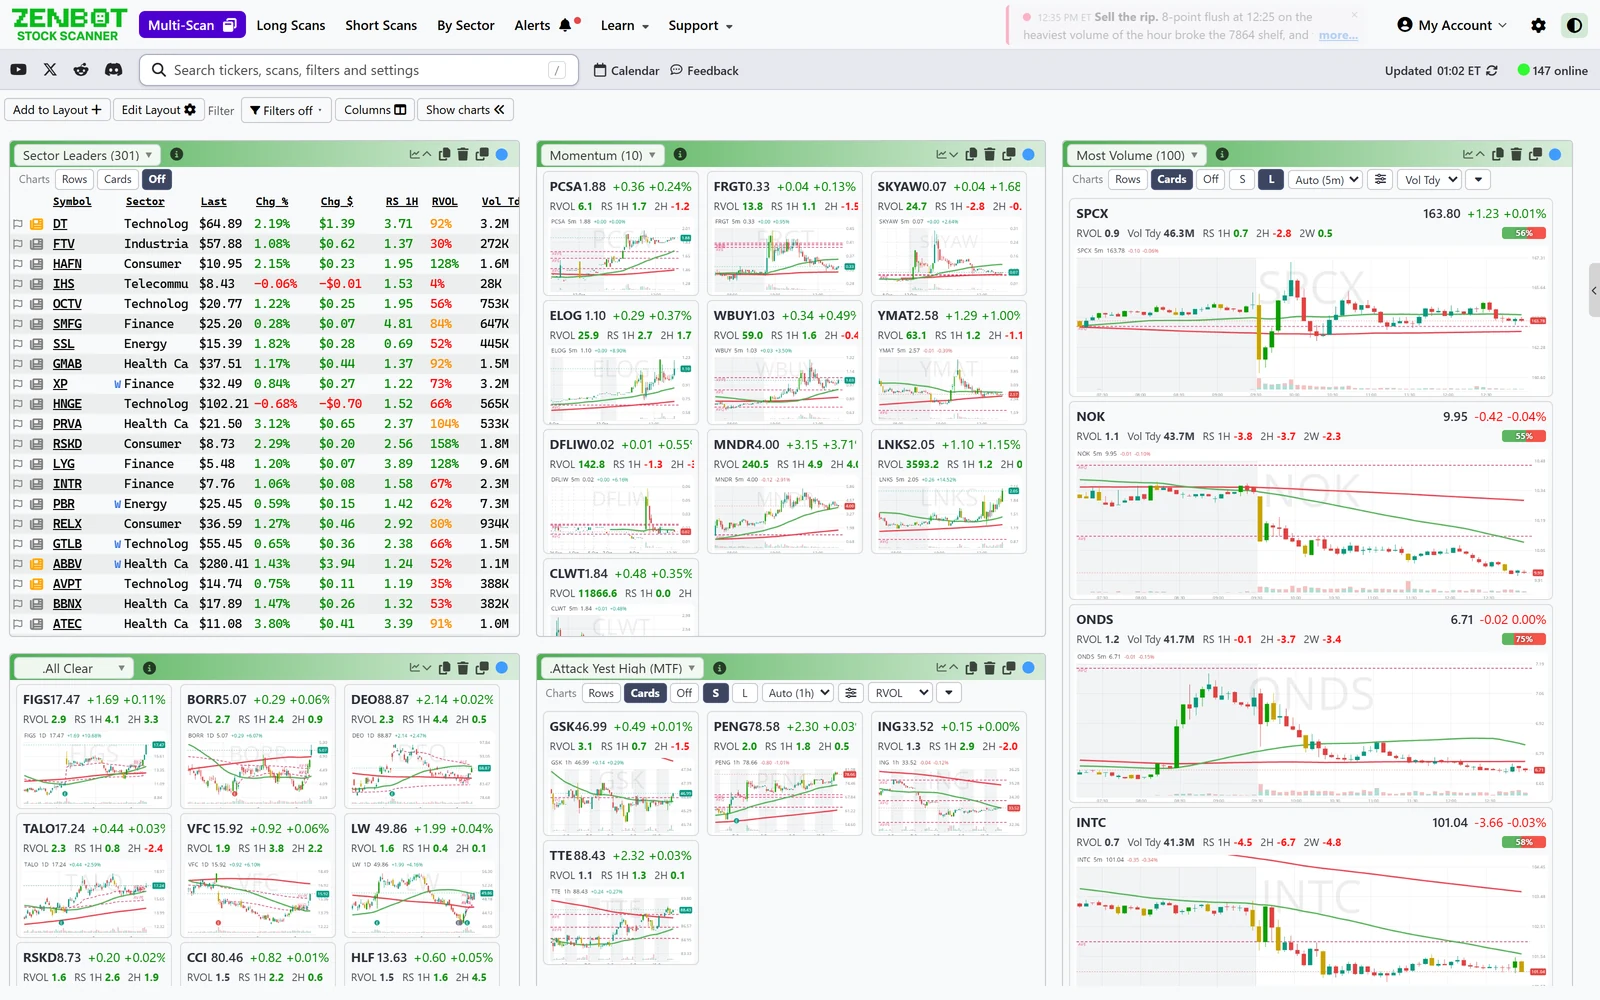
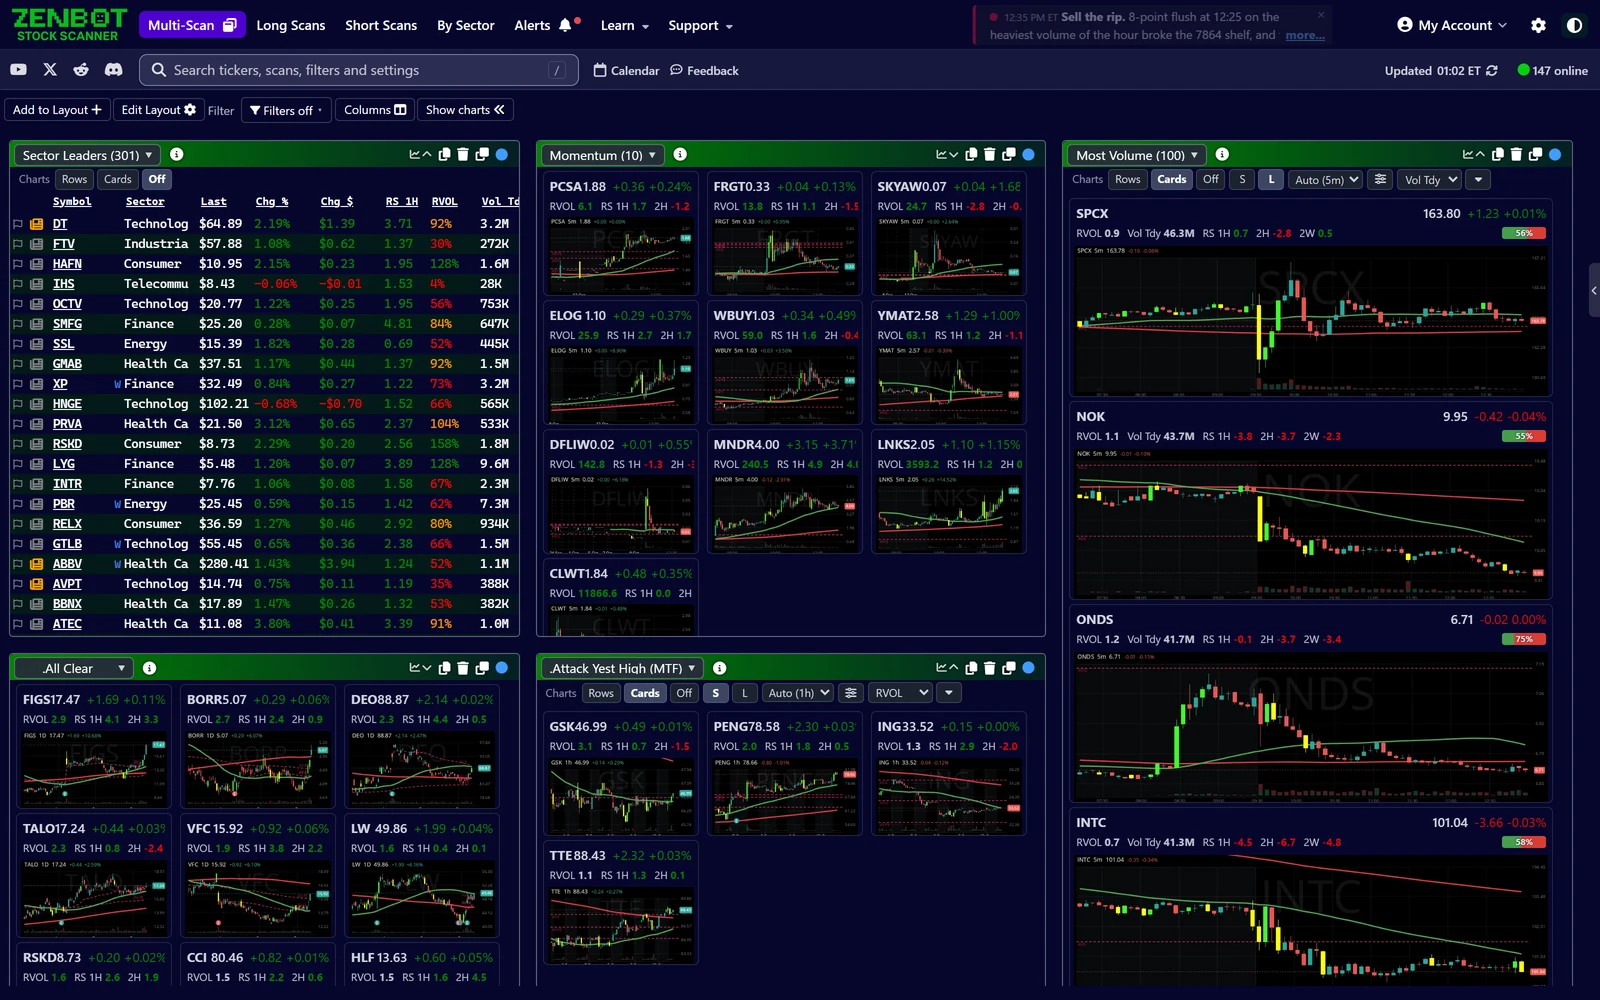
Zen's MultiScan view
Put your favorite scans side by side. Move scans and charts to other monitors, and link windows so picking a ticker updates them together.
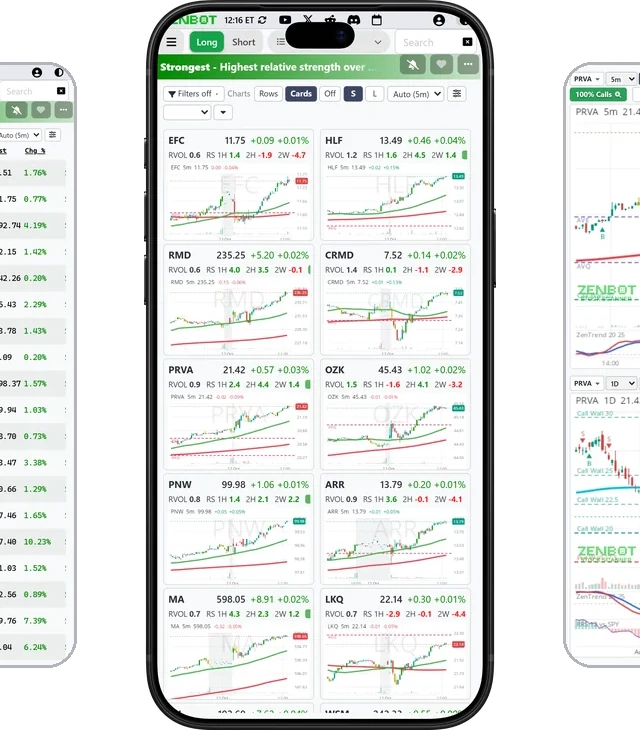
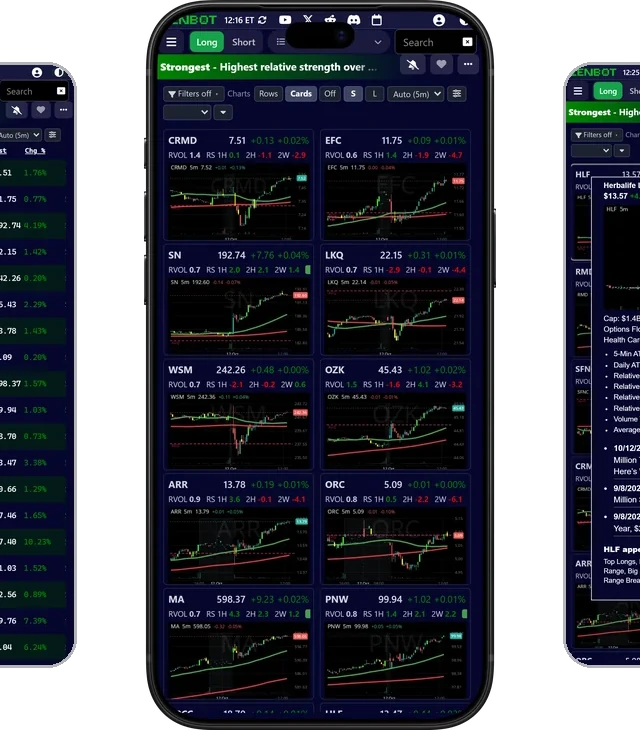
ZenBot on your phone
The scans, charts and alerts work in your phone's browser. Nothing to install.
Windows App: launch charts in your own app
Click a ticker in ZenBot and it opens in your charting app: TradingView, thinkorswim, TC2000 or IBKR. It takes the free ZenBot Windows app.
Get it from the Microsoft Store
A few common questions
Is ZenBot free?
Yes. The whole scanner is free on a 15-minute delay. Turbo is $25 a month for live data.
How is it different from TradingView or Finviz?
ZenBot has 89 built-in scans that use relative strength against SPY and sectors, plus options flow. You can change the filters or build a scan yourself.
What do I get with Turbo?
Live data, real-time alerts with charts, and your own indicators on every chart. 14-day free trial.
Do I need to install anything?
No. It runs in your browser and on your phone. There's a free Windows app if you want one.
What stocks does it cover?
About 6,600 US stocks and ETFs, including premarket and after-hours.
Does ZenBot tell me what to buy?
No. It shows stocks that match scan conditions. You still need to check the chart and decide for yourself.
A few more things
Premarket and after-hours scans. News and earnings flags. Live commentary. Saved filter sets. Everything synced across web, Windows and your phone.
If you're new, I'd start with In Play and Top Longs. ZenBot is a one-person project. It's just me and all of you.