All scans · Short
Old Gap Fill - Short
Open live →ZenBot is a free real-time scanner that surfaces the stocks in play — heavy volume, leading their sector, moving before the crowd. This is one of its built-in scans.
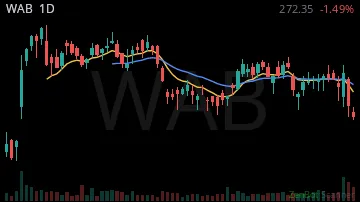
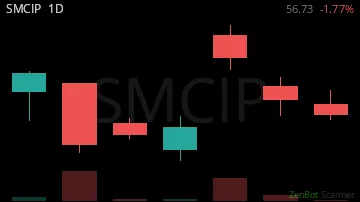
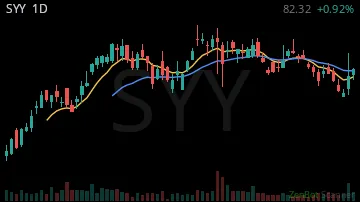

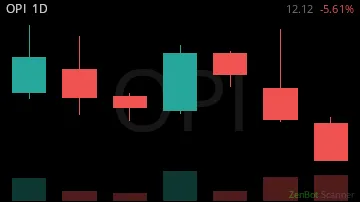
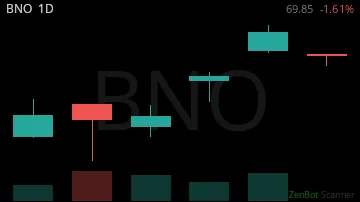
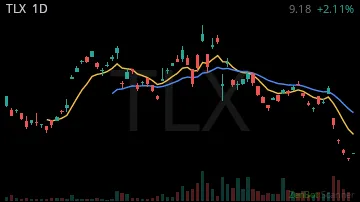

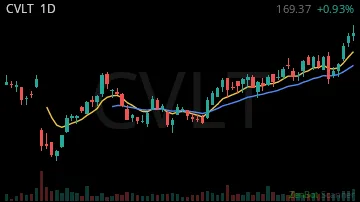
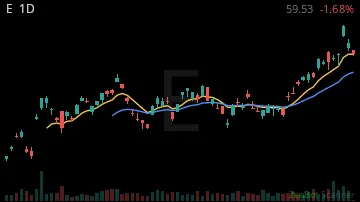

| Symbol | Chart | Sector | Last | Chg % | Chg $ | RS 1H | RS 2W | RVOL | Vol |
|---|---|---|---|---|---|---|---|---|---|
| WAB |  | Industrials | 272.35 | 0.00% | 0.00 | -0.11 | 1.12 | 0% | 9 |
| SMCIP |  | Technology | 56.73 | 0.00% | 0.00 | 3.05 | 0.00 | 9% | 0 |
| SYY |  | Consumer Dis | 81.37 | 0.00% | 0.00 | -0.97 | 5.33 | 68% | 0 |
| DG |  | Consumer Sta | 132.40 | 0.00% | -0.29 | -3.97 | 4.79 | 81% | 0 |
| OPI |  | Finance | 12.12 | 0.00% | 0.00 | -3.02 | 9.90 | 83% | 0 |
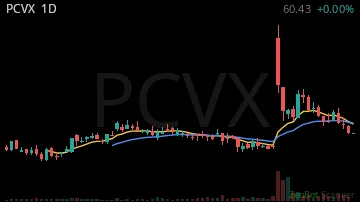
| PCVX | 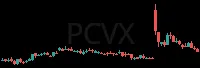 | Health Care | 60.43 | 0.00% | 0.00 | -3.90 | 0.64 | 90% | 0 |
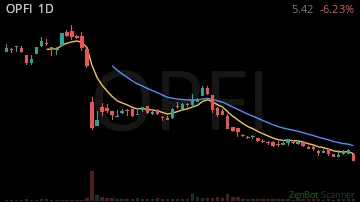
| OPFI | 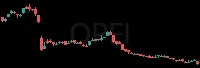 | Finance | 5.42 | 0.00% | 0.00 | 2.07 | -0.95 | 90% | 0 |
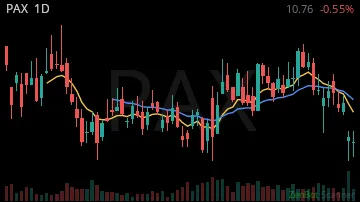
| PAX | 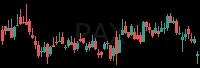 | Finance | 10.20 | -0.13% | -1.54 | -6.74 | 4.29 | 100% | 76.8K |
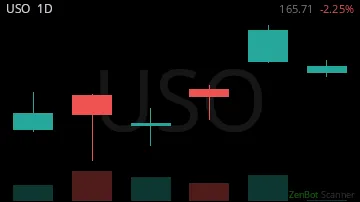
| USO |  | 164.79 | -0.03% | -4.74 | -6.79 | 12.68 | 100% | 111.8K | |
| BNO | 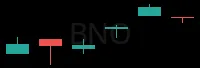 | 69.38 | -0.02% | -1.61 | -9.34 | 13.02 | 100% | 18.1K | |
| TLX | 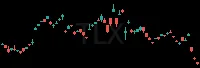 | Health Care | 9.21 | +0.01% | +0.06 | 7.21 | -2.70 | 111% | 0 |
| GRNT |  | Energy | 5.86 | 0.00% | 0.00 | 0.81 | 7.83 | 132% | 0 |
| CVLT | 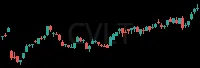 | Technology | 169.37 | 0.00% | 0.00 | 0.69 | 5.24 | 158% | 0 |
| E | 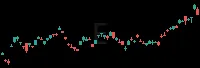 | Energy | 60.49 | -0.03% | -1.59 | -15.74 | 9.03 | 168% | 3.5K |
| BUD |  | Consumer Sta | 81.62 | -0.03% | -2.64 | -5.41 | 8.29 | 548% | 15.8K |
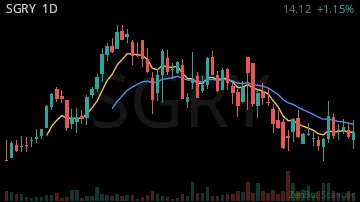
| SGRY | 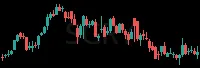 | Health Care | 19.45 | +0.23% | +3.70 | 0.50 | 5.97 | 3,461% | 10.2K |
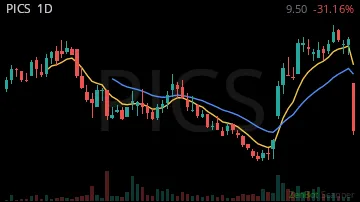
| PICS |  | Finance | 9.70 | -0.30% | -4.10 | -3.77 | 4.54 | 4,409% | 15.3K |
RS = relative strength vs SPY, in ATRs (1 hour / 2 weeks); green leads the market, red lags. RVOL = today's volume vs average. Prices are 15-minute delayed.
New here? How to trade these scans · More Gaps scans: Gap Fade · Falling Into Gap