All scans · Short
After Earnings - Short
Open live →ZenBot is a free real-time scanner that surfaces the stocks in play — heavy volume, leading their sector, moving before the crowd. This is one of its built-in scans.
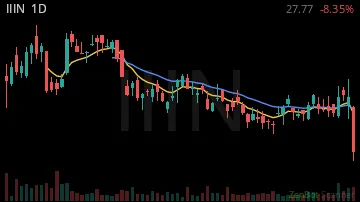
IIIN28.02 +0.01%
FLG10.40 0.00%

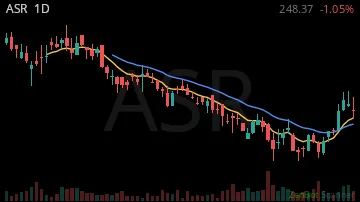
ASR248.37 0.00%
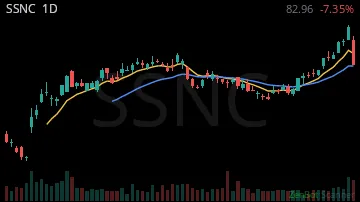
SSNC82.96 0.00%
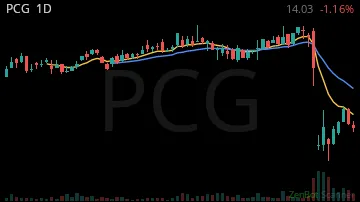
PCG12.63 0.00%
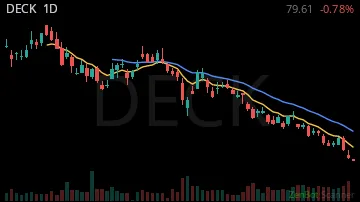
DECK81.21 0.00%
WDC343.67 0.00%

MXL63.50 0.00%

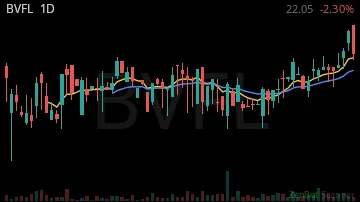
BVFL22.05 0.00%
TTMI80.54 +0.01%

NEM110.76 +0.02%

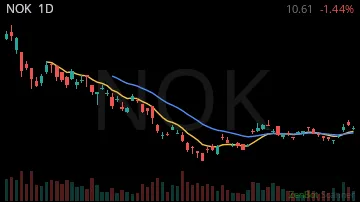
NOK8.30 +0.02%
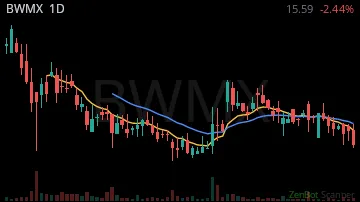
BWMX15.59 0.00%
BCS22.20 +0.02%
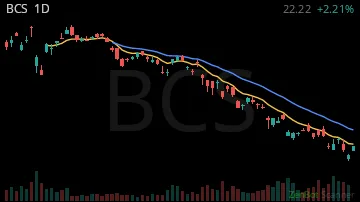
INFY12.42 +0.01%

FIX1167.06 +0.01%
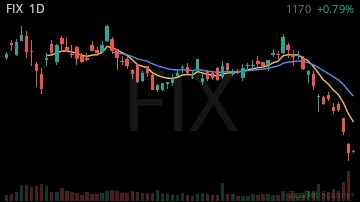
NKSH40.48 0.00%
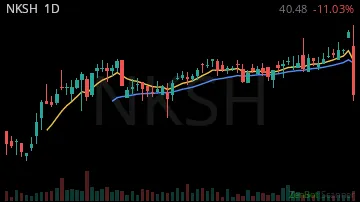
ALV115.43 +0.01%
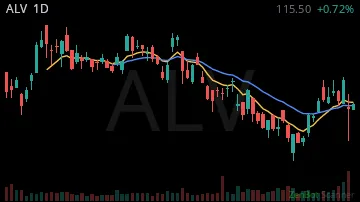
AXP314.90 +0.01%

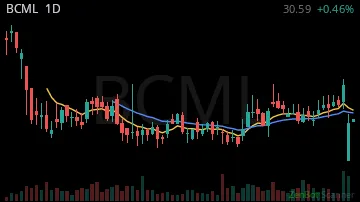
BCML30.51 0.00%
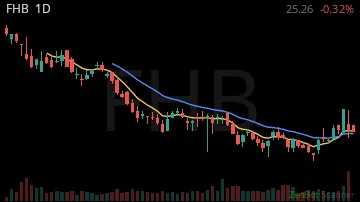
FHB25.26 0.00%
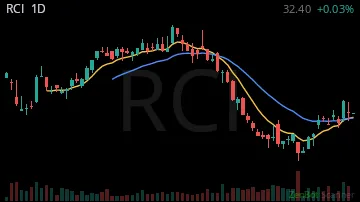
RCI32.40 0.00%
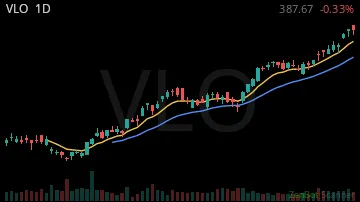
VLO417.25 0.00%
BE193.50 0.00%

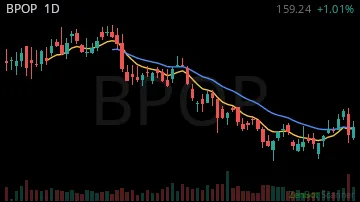
BPOP159.17 0.00%
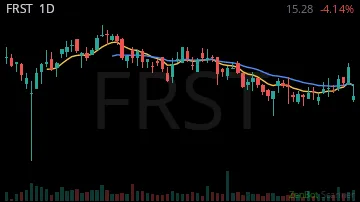
FRST15.28 0.00%
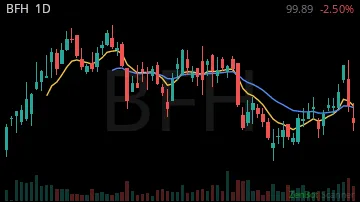
BFH99.89 0.00%
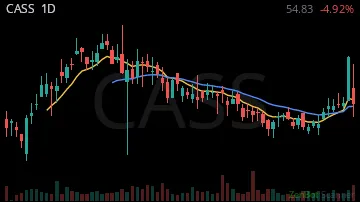
CASS54.34 -0.01%
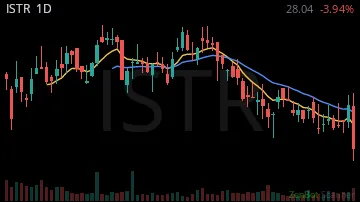
ISTR28.04 0.00%
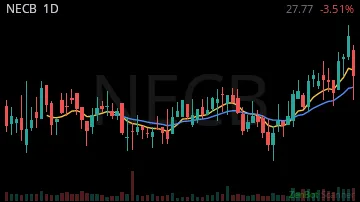
NECB27.77 0.00%
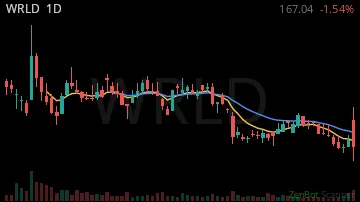
WRLD167.06 0.00%
COCO56.53 0.00%

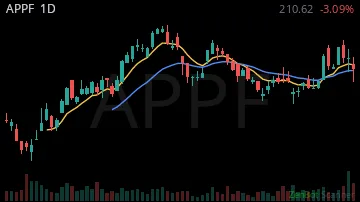
APPF211.60 0.00%
GNTX20.69 0.00%

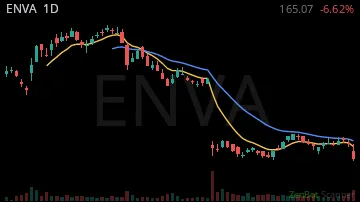
ENVA165.07 0.00%
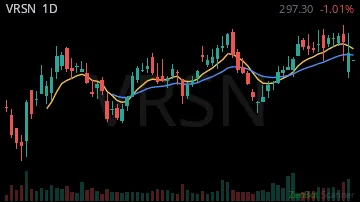
VRSN299.00 0.00%
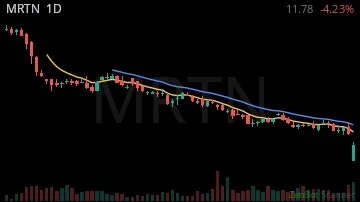
MRTN11.78 0.00%
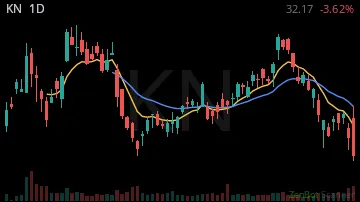
KN32.17 0.00%
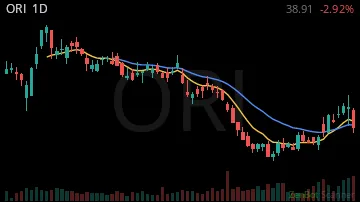
ORI38.91 0.00%
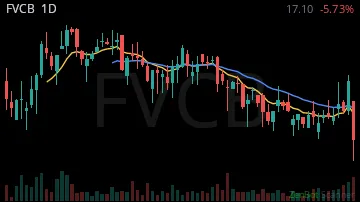
FVCB16.02 -0.06%
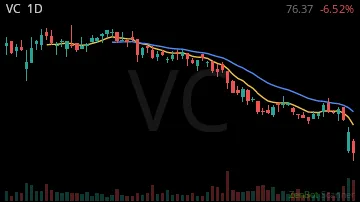
VC76.37 0.00%
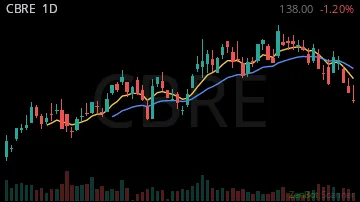
CBRE123.30 0.00%
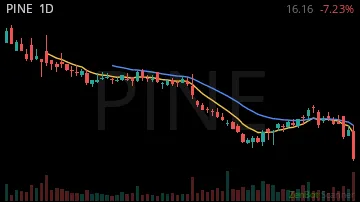
PINE16.16 0.00%
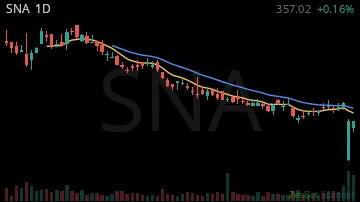
SNA357.02 0.00%
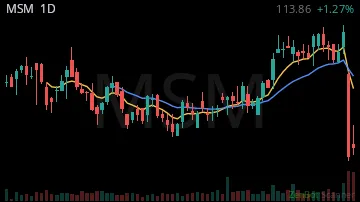
MSM114.66 +0.01%
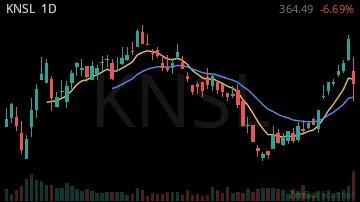
KNSL364.49 0.00%
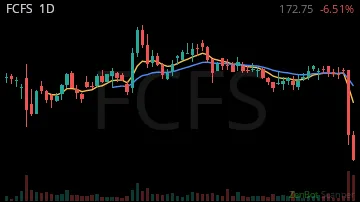
FCFS172.00 0.00%
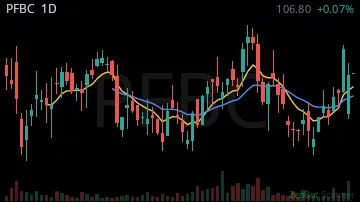
PFBC106.80 0.00%
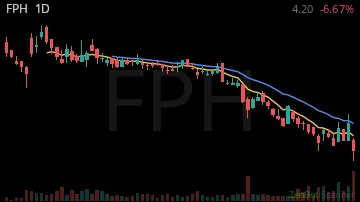
FPH4.20 0.00%
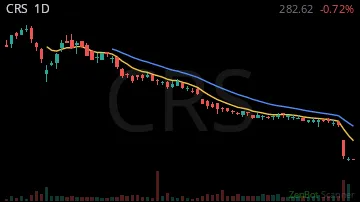
CRS283.71 0.00%
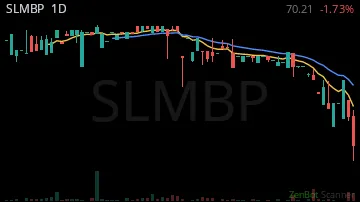
SLMBP70.21 0.00%
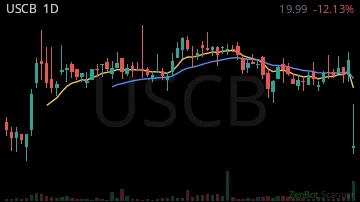
USCB20.01 0.00%
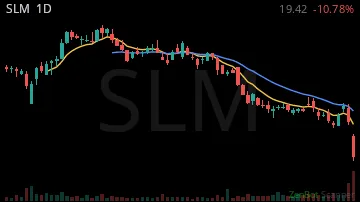
SLM19.69 +0.01%
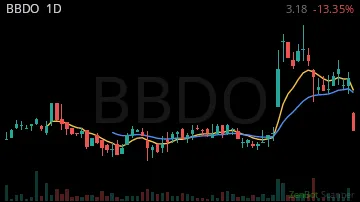
BBDO3.21 -0.13%
| Symbol | Chart | Sector | Last | Chg % | Chg $ | RS 1H | RS 2W | RVOL | Vol |
|---|---|---|---|---|---|---|---|---|---|
| IIIN | 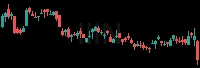 | Industrials | 28.02 | +0.01% | +0.25 | 13.18 | 0.55 | 0% | 1 |
| FLG |  | Finance | 10.40 | 0.00% | +0.02 | -7.25 | -0.21 | 0% | 54 |
| ASR | 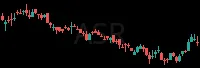 | Consumer Dis | 248.37 | 0.00% | 0.00 | 0.77 | 4.96 | 0% | 1 |
| SSNC |  | Technology | 82.96 | 0.00% | 0.00 | -3.55 | 4.39 | 0% | 79 |
| PCG | 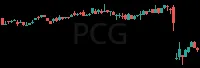 | Utilities | 12.63 | 0.00% | 0.00 | 10.81 | 2.01 | 0% | 463 |
| DECK | 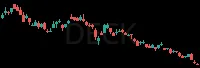 | Consumer Dis | 81.21 | 0.00% | +0.12 | 10.54 | 2.62 | 4% | 783 |
| WDC |  | Technology | 343.67 | 0.00% | 0.00 | 2.73 | -0.57 | 29% | 25.5K |
| MXL |  | Technology | 63.50 | 0.00% | +0.04 | 0.26 | -2.58 | 30% | 14.9K |
| BVFL |  | Finance | 22.05 | 0.00% | 0.00 | -3.32 | 2.80 | 37% | 0 |
| TTMI |  | Technology | 80.54 | +0.01% | +0.43 | -1.57 | -1.96 | 42% | 4.6K |
| NEM |  | Basic Materi | 110.76 | +0.02% | +1.89 | 0.53 | 1.17 | 45% | 14.9K |
| NOK |  | Technology | 8.30 | +0.02% | +0.16 | 0.98 | -2.43 | 48% | 776.0K |
| BWMX | 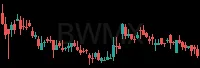 | Consumer Dis | 15.59 | 0.00% | 0.00 | -0.72 | 1.02 | 59% | 0 |
| BCS |  | Finance | 22.20 | +0.02% | +0.46 | 9.49 | -0.31 | 63% | 16.9K |
| INFY |  | Technology | 12.42 | +0.01% | +0.07 | -12.25 | 6.12 | 69% | 16.1K |
| FIX | 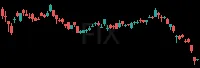 | Industrials | 1167.06 | +0.01% | +6.20 | -1.63 | -3.83 | 80% | 266 |
| NKSH | 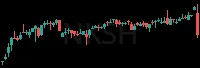 | Finance | 40.48 | 0.00% | 0.00 | 2.82 | 0.88 | 94% | 0 |
| ALV | 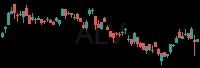 | Consumer Dis | 115.43 | +0.01% | +0.76 | 3.18 | 3.74 | 100% | 3.3K |
| AXP |  | Finance | 314.90 | +0.01% | +1.68 | 4.00 | 3.72 | 100% | 1.5K |
| BCML | 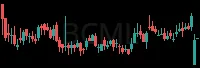 | Finance | 30.51 | 0.00% | +0.06 | 11.90 | 1.95 | 100% | 114 |
| FHB | 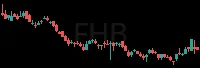 | Finance | 25.26 | 0.00% | -0.08 | -1.32 | 3.74 | 100% | 246 |
| RCI |  | Telecommunic | 32.40 | 0.00% | +0.01 | -9.88 | 4.26 | 100% | 399 |
| VLO |  | Energy | 417.25 | 0.00% | -2.03 | -0.57 | 2.12 | 100% | 985 |
| BE |  | Energy | 193.50 | 0.00% | +0.20 | 2.26 | -2.51 | 102% | 240.8K |
| BPOP | 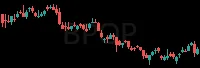 | Finance | 159.17 | 0.00% | -0.07 | 0.81 | 3.57 | 104% | 0 |
| FRST | 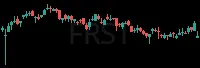 | Finance | 15.28 | 0.00% | 0.00 | 0.89 | 2.48 | 115% | 0 |
| BFH |  | Consumer Dis | 99.89 | 0.00% | 0.00 | 3.35 | 3.00 | 118% | 0 |
| CASS |  | Consumer Dis | 54.34 | -0.01% | -0.49 | 1.91 | 3.48 | 128% | 0 |
| ISTR |  | Finance | 28.04 | 0.00% | 0.00 | 4.33 | 0.87 | 135% | 0 |
| NECB |  | Finance | 27.77 | 0.00% | 0.00 | 3.76 | 2.97 | 155% | 0 |
| WRLD | 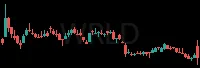 | Finance | 167.06 | 0.00% | +0.02 | 0.23 | 0.84 | 162% | 0 |
| COCO | 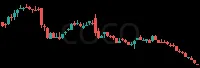 | Consumer Sta | 56.53 | 0.00% | 0.00 | 0.81 | 4.03 | 163% | 0 |
| APPF |  | Technology | 211.60 | 0.00% | +0.98 | 0.17 | 3.77 | 168% | 0 |
| GNTX |  | Consumer Dis | 20.69 | 0.00% | +0.03 | 14.53 | 1.64 | 171% | 0 |
| ENVA | 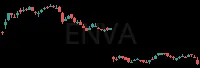 | Finance | 165.07 | 0.00% | 0.00 | -0.40 | -0.98 | 178% | 0 |
| VRSN |  | Technology | 299.00 | 0.00% | -1.32 | -13.35 | 3.09 | 183% | 0 |
| MRTN | 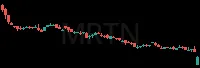 | Industrials | 11.78 | 0.00% | 0.00 | -1.10 | 0.26 | 184% | 0 |
| KN | 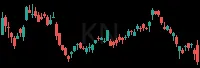 | Consumer Sta | 32.17 | 0.00% | 0.00 | -3.58 | -1.35 | 192% | 0 |
| ORI | 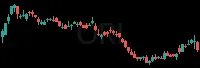 | Finance | 38.91 | 0.00% | 0.00 | 1.89 | 3.80 | 207% | 0 |
| FVCB |  | Finance | 16.02 | -0.06% | -1.08 | -3.56 | 1.58 | 209% | 0 |
| VC | 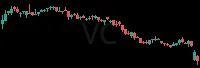 | Consumer Dis | 76.37 | 0.00% | 0.00 | 1.10 | -0.86 | 210% | 0 |
| CBRE |  | Finance | 123.30 | 0.00% | 0.00 | -2.02 | 1.54 | 215% | 0 |
| PINE | 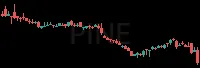 | Real Estate | 16.16 | 0.00% | 0.00 | -1.86 | -0.17 | 249% | 0 |
| SNA | 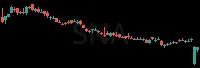 | Consumer Dis | 357.02 | 0.00% | 0.00 | 4.28 | 2.04 | 295% | 0 |
| MSM |  | Industrials | 114.66 | +0.01% | +0.80 | 11.84 | -1.01 | 297% | 0 |
| KNSL |  | Finance | 364.49 | 0.00% | 0.00 | -5.37 | 5.36 | 303% | 0 |
| FCFS | 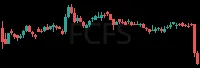 | Consumer Dis | 172.00 | 0.00% | -0.75 | -4.67 | -1.94 | 351% | 0 |
| PFBC |  | Finance | 106.80 | 0.00% | +0.08 | -16.55 | 4.05 | 369% | 1.0K |
| FPH | 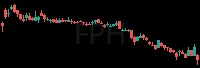 | Finance | 4.20 | 0.00% | 0.00 | 3.64 | 0.36 | 371% | 0 |
| CRS | 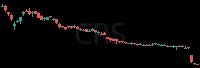 | Industrials | 283.71 | 0.00% | -0.95 | 8.39 | -3.51 | 385% | 638 |
| SLMBP | 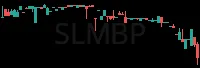 | Finance | 70.21 | 0.00% | 0.00 | 1.68 | -1.46 | 387% | 0 |
| USCB | 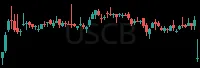 | Finance | 20.01 | 0.00% | +0.02 | -2.79 | -0.30 | 407% | 0 |
| SLM | 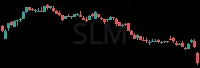 | Finance | 19.69 | +0.01% | +0.28 | -6.46 | -1.25 | 530% | 0 |
| BBDO | 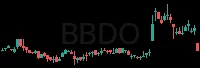 | Finance | 3.21 | -0.13% | -0.46 | -14.50 | 1.46 | 2,065% | 5.5K |
RS = relative strength vs SPY, in ATRs (1 hour / 2 weeks); green leads the market, red lags. RVOL = today's volume vs average. Prices are 15-minute delayed.
New here? How to trade these scans · More News+Earnings scans: Down On News · Earnings Losers · Earnings Soon - Short