All scans · Short
SMA Magnet - Short
Open live →ZenBot is a free real-time scanner that surfaces the stocks in play — heavy volume, leading their sector, moving before the crowd. This is one of its built-in scans.
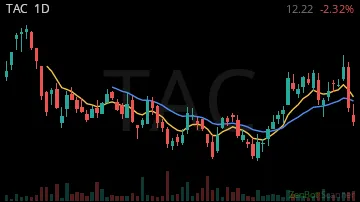
TAC12.22 0.00%
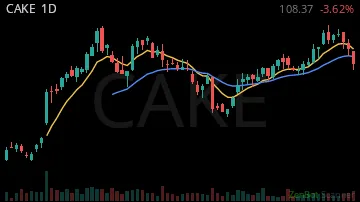
CAKE107.00 -0.01%
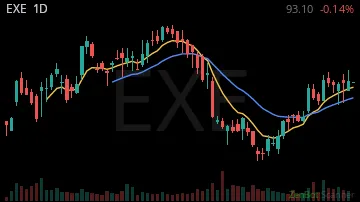
EXE93.17 0.00%
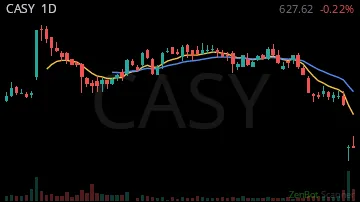
CASY699.26 0.00%
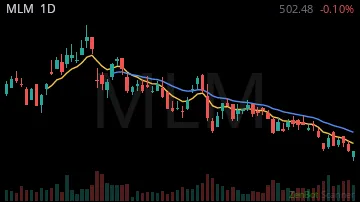
MLM507.17 0.00%
BBNX19.16 0.00%

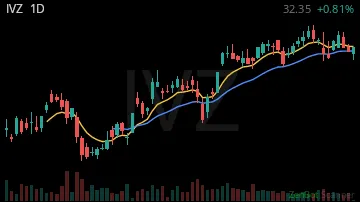
IVZ28.24 +0.01%
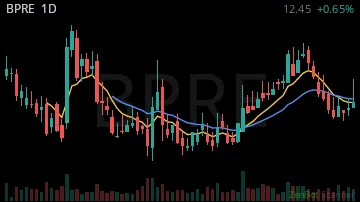
BPRE12.55 +0.01%
PAYO7.15 0.00%

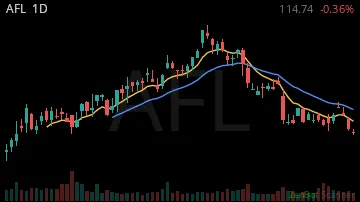
AFL120.51 0.00%
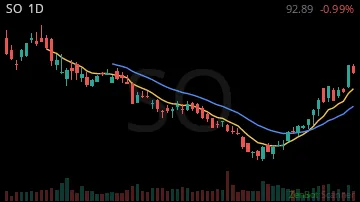
SO92.99 0.00%
CRK14.13 0.00%

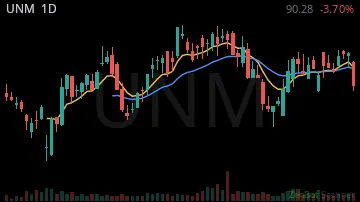
UNM90.28 0.00%
SBAC184.69 0.00%

PTEN11.95 0.00%

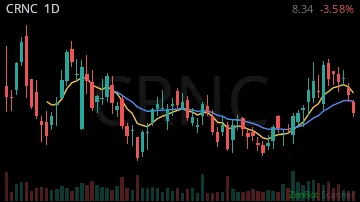
CRNC8.39 +0.01%
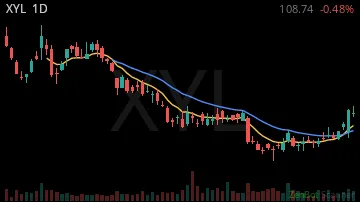
XYL109.59 +0.01%
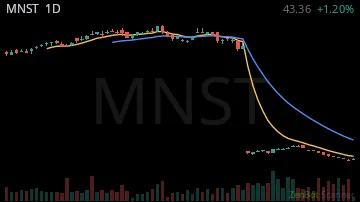
MNST46.59 +0.01%
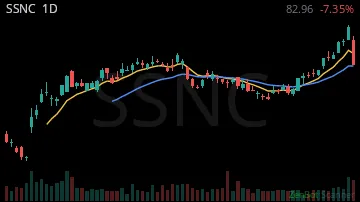
SSNC82.96 0.00%
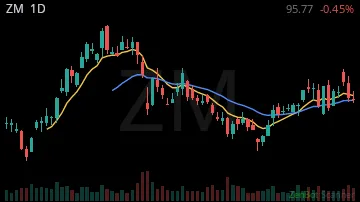
ZM95.70 0.00%
NVCR14.68 0.00%

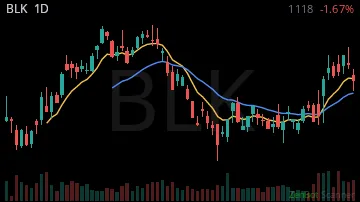
BLK1118.09 0.00%
DK74.41 0.00%

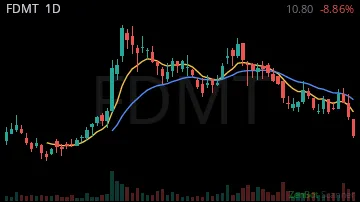
FDMT10.80 0.00%
CLYM10.19 0.00%

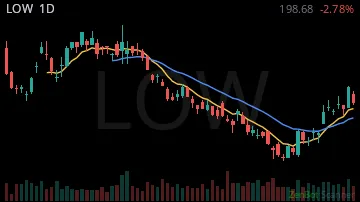
LOW198.68 0.00%
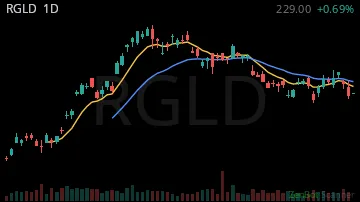
RGLD228.30 0.00%
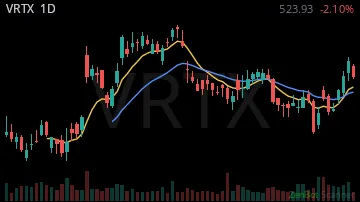
VRTX523.41 0.00%
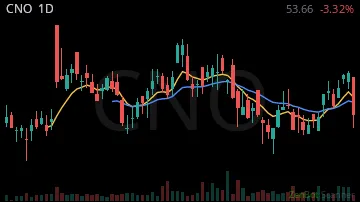
CNO53.66 0.00%
NXPI236.40 +0.01%

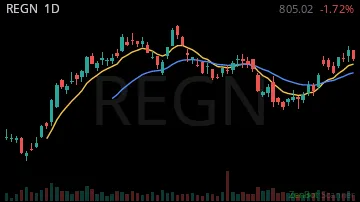
REGN804.00 0.00%
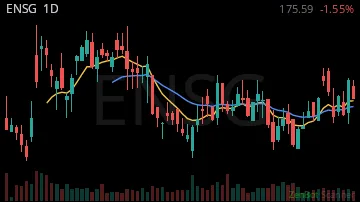
ENSG175.59 0.00%
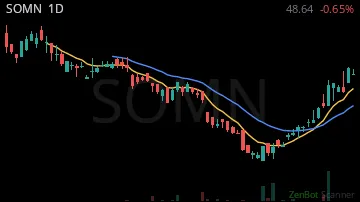
SOMN48.64 0.00%
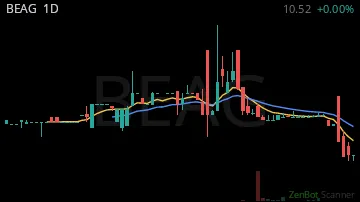
BEAG10.52 0.00%
WEAV7.40 0.00%

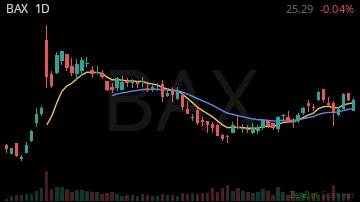
BAX24.59 -0.03%
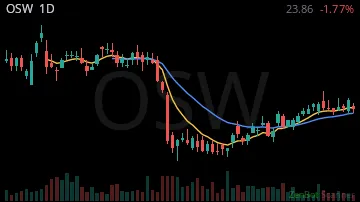
OSW23.86 0.00%
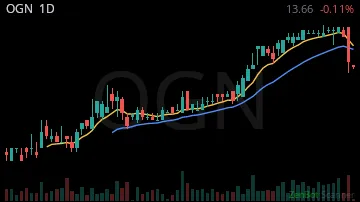
OGN13.74 0.00%
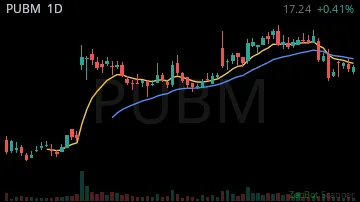
PUBM17.35 +0.01%
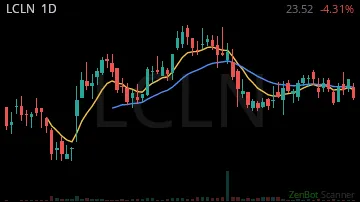
LCLN23.52 0.00%
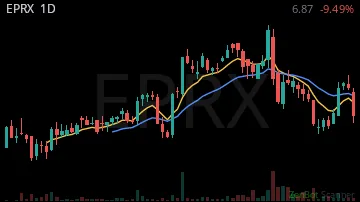
EPRX6.99 +0.02%
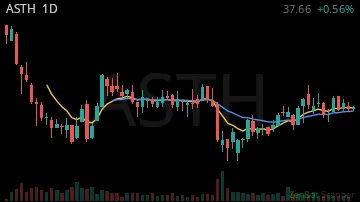
ASTH37.45 0.00%
REG73.98 0.00%

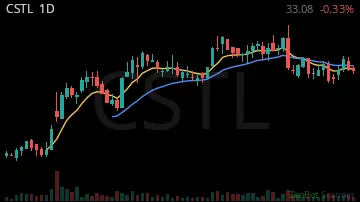
CSTL33.08 0.00%
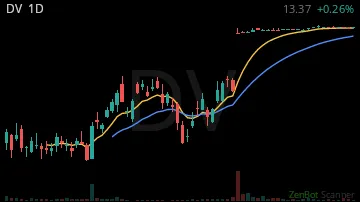
DV13.54 0.00%
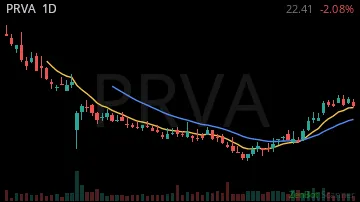
PRVA22.41 0.00%
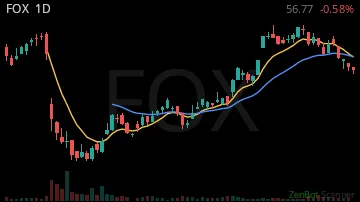
FOX59.46 0.00%
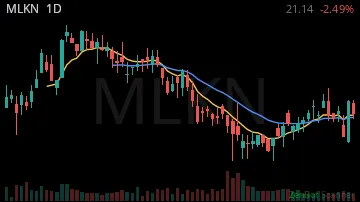
MLKN21.14 0.00%
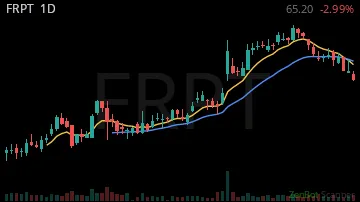
FRPT64.12 0.00%
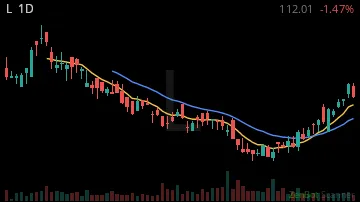
L112.01 0.00%
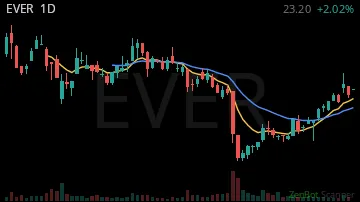
EVER22.74 0.00%
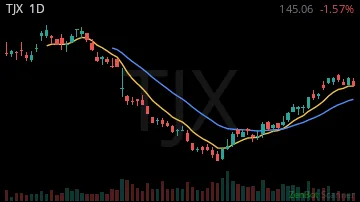
TJX145.06 0.00%
GAP22.25 0.00%

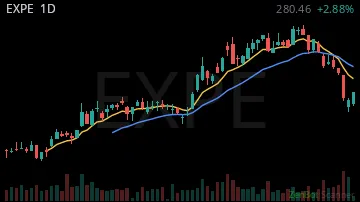
EXPE297.00 +0.03%
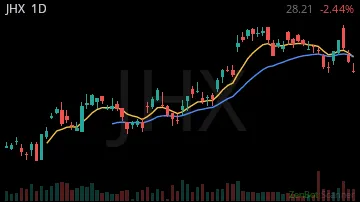
JHX26.15 0.00%
ARX19.77 0.00%

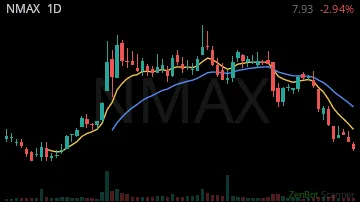
NMAX8.00 +0.01%
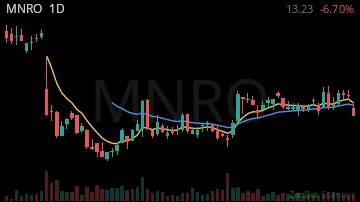
MNRO13.23 0.00%
TARS68.20 0.00%

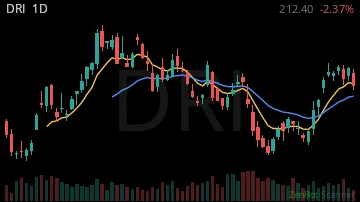
DRI212.40 0.00%
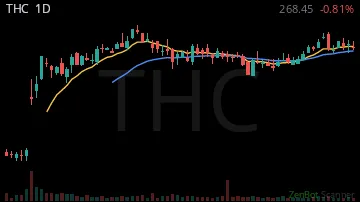
THC268.45 0.00%
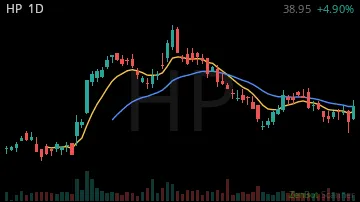
HP38.95 0.00%
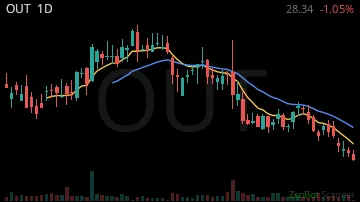
OUT31.03 0.00%
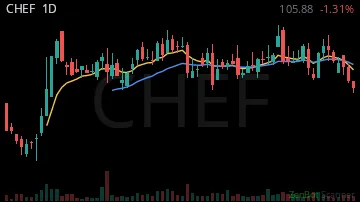
CHEF105.50 0.00%
SVV9.37 0.00%

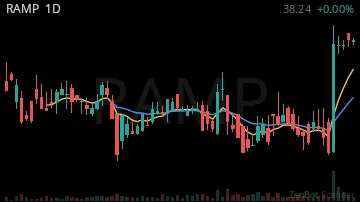
RAMP38.24 0.00%
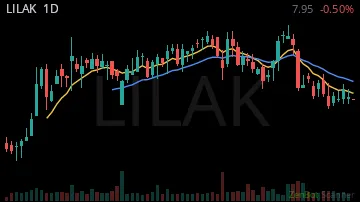
LILAK7.99 0.00%
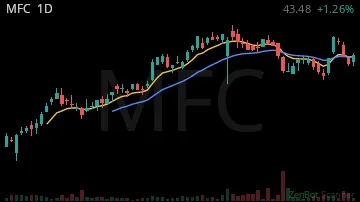
MFC44.26 0.00%
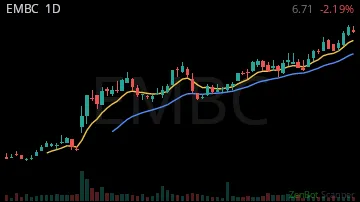
EMBC6.71 0.00%
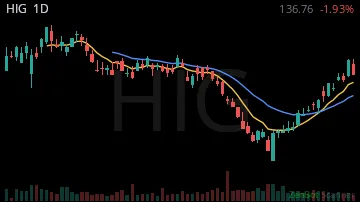
HIG136.76 0.00%
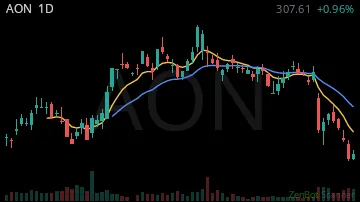
AON303.52 0.00%
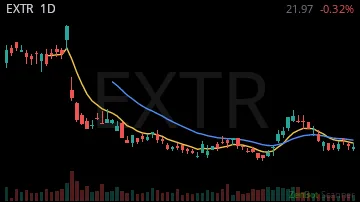
EXTR22.39 +0.02%
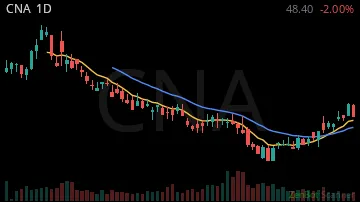
CNA48.40 0.00%
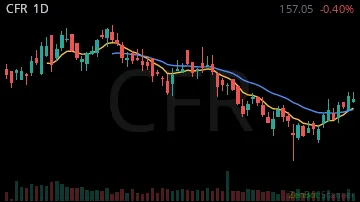
CFR157.05 0.00%
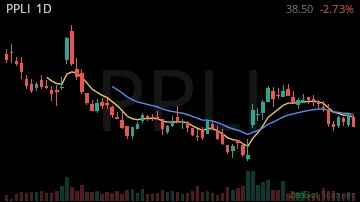
PPLI38.50 0.00%
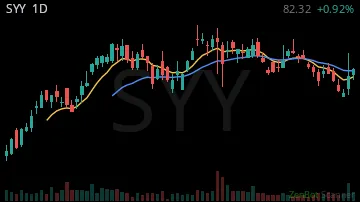
SYY81.37 0.00%
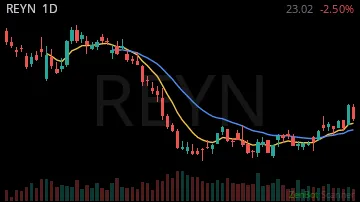
REYN23.00 0.00%
PB69.60 0.00%

DNOW15.16 -0.03%

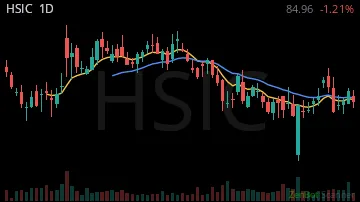
HSIC84.96 0.00%
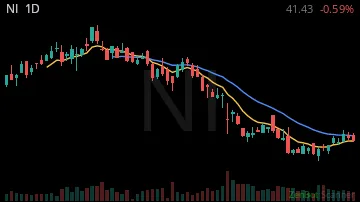
NI43.28 0.00%
RVLV23.00 +0.03%

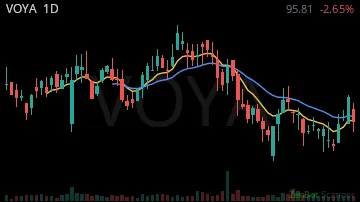
VOYA95.81 0.00%
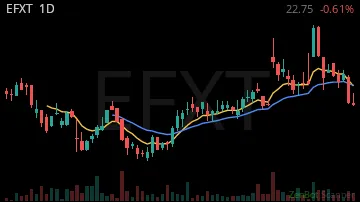
EFXT22.75 0.00%
INGM27.69 0.00%

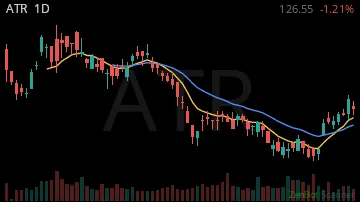
ATR126.55 0.00%
SRE84.06 0.00%

STLD241.53 0.00%

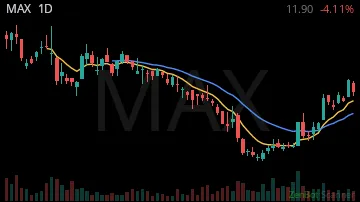
MAX11.90 0.00%
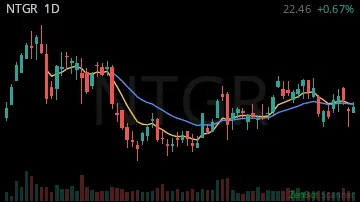
NTGR22.46 0.00%
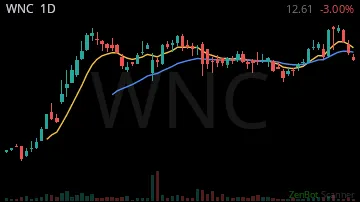
WNC12.87 0.00%
CAG14.87 0.00%

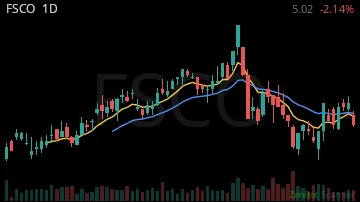
FSCO5.02 0.00%
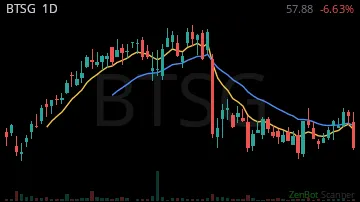
BTSG60.09 0.00%
SMPL10.41 0.00%

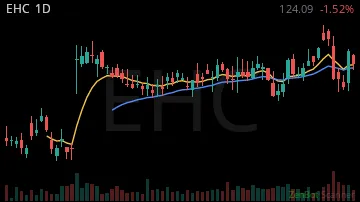
EHC124.09 0.00%
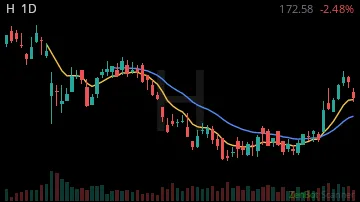
H172.58 0.00%
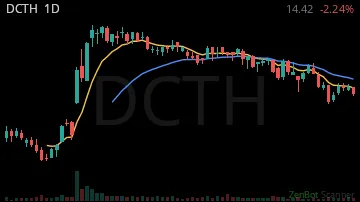
DCTH14.42 0.00%
PFGC94.71 0.00%

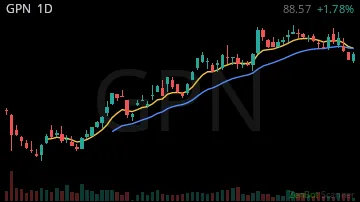
GPN82.82 0.00%
| Symbol | Chart | Sector | Last | Chg % | Chg $ | RS 1H | RS 2W | RVOL | Vol |
|---|---|---|---|---|---|---|---|---|---|
| TAC | 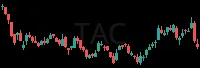 | Utilities | 12.22 | 0.00% | 0.00 | -2.08 | 0.86 | 0% | 1 |
| CAKE |  | Consumer Dis | 107.00 | -0.01% | -1.37 | -6.03 | 2.78 | 0% | 1 |
| EXE |  | Energy | 93.17 | 0.00% | -0.06 | -15.61 | 4.67 | 0% | 3 |
| CASY | 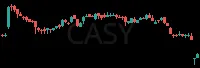 | Consumer Dis | 699.26 | 0.00% | 0.00 | 0.02 | 6.04 | 0% | 1 |
| MLM | 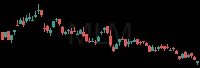 | Industrials | 507.17 | 0.00% | 0.00 | -2.87 | 4.73 | 0% | 2 |
| BBNX | 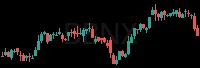 | Health Care | 19.16 | 0.00% | 0.00 | 0.35 | 3.46 | 0% | 5 |
| IVZ |  | Finance | 28.24 | +0.01% | +0.18 | 0.07 | -0.12 | 0% | 17 |
| BPRE |  | 12.55 | +0.01% | +0.10 | 10.03 | 1.20 | 0% | 4 | |
| PAYO |  | Consumer Dis | 7.15 | 0.00% | 0.00 | 1.21 | 1.97 | 0% | 13 |
| AFL | 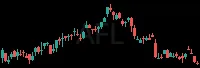 | Finance | 120.51 | 0.00% | 0.00 | -1.97 | 5.80 | 0% | 16 |
| SO | 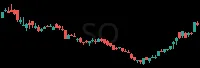 | Utilities | 92.99 | 0.00% | +0.10 | -2.71 | 6.87 | 0% | 64 |
| CRK |  | Energy | 14.13 | 0.00% | 0.00 | 2.52 | 3.05 | 0% | 29 |
| UNM |  | Finance | 90.28 | 0.00% | 0.00 | 0.62 | 1.07 | 0% | 20 |
| SBAC | 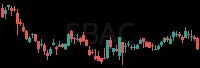 | Real Estate | 184.69 | 0.00% | -0.06 | 1.96 | 4.31 | 0% | 13 |
| PTEN |  | Energy | 11.95 | 0.00% | -0.02 | -4.24 | 3.79 | 0% | 128 |
| CRNC |  | Technology | 8.39 | +0.01% | +0.05 | 3.58 | 2.50 | 0% | 14 |
| XYL | 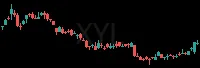 | Industrials | 109.59 | +0.01% | +0.85 | 12.44 | 5.37 | 0% | 88 |
| MNST |  | Consumer Sta | 46.59 | +0.01% | +0.40 | 11.53 | 5.48 | 0% | 485 |
| SSNC |  | Technology | 82.96 | 0.00% | 0.00 | -3.55 | 4.39 | 0% | 79 |
| ZM |  | Technology | 95.70 | 0.00% | -0.07 | -1.45 | 2.65 | 0% | 186 |
| NVCR |  | Health Care | 14.68 | 0.00% | 0.00 | 0.52 | 2.42 | 0% | 89 |
| BLK | 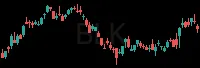 | Finance | 1118.09 | 0.00% | -0.16 | -0.30 | 4.19 | 0% | 42 |
| DK | 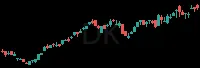 | Energy | 74.41 | 0.00% | 0.00 | 2.50 | 2.11 | 0% | 166 |
| FDMT | 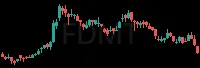 | Health Care | 10.80 | 0.00% | 0.00 | 2.44 | 0.38 | 0% | 89 |
| CLYM |  | Health Care | 10.19 | 0.00% | 0.00 | -1.85 | 1.69 | 0% | 117 |
| LOW | 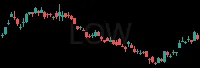 | Consumer Dis | 198.68 | 0.00% | 0.00 | -2.19 | 5.63 | 0% | 281 |
| RGLD | 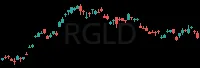 | Industrials | 228.30 | 0.00% | +0.88 | -14.67 | 2.33 | 0% | 92 |
| VRTX |  | Health Care | 523.41 | 0.00% | -0.52 | -0.89 | 3.70 | 0% | 170 |
| CNO | 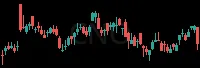 | Finance | 53.66 | 0.00% | 0.00 | 2.15 | 3.07 | 0% | 118 |
| NXPI | 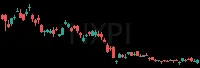 | Technology | 236.40 | +0.01% | +1.48 | -2.38 | 2.36 | 0% | 647 |
| REGN | 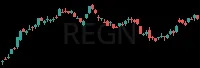 | Health Care | 804.00 | 0.00% | -1.02 | -10.45 | 5.26 | 0% | 159 |
| ENSG |  | Health Care | 175.59 | 0.00% | 0.00 | -3.72 | 4.11 | 0% | 204 |
| SOMN | 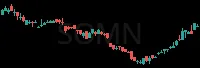 | Utilities | 48.64 | 0.00% | 0.00 | -2.09 | 6.61 | 2% | 0 |
| BEAG |  | Finance | 10.52 | 0.00% | 0.00 | 3.81 | -1.26 | 8% | 0 |
| WEAV |  | Technology | 7.40 | 0.00% | 0.00 | 2.80 | 3.78 | 22% | 0 |
| BAX | 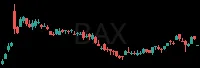 | Health Care | 24.59 | -0.03% | -0.71 | -2.19 | 4.13 | 32% | 91 |
| OSW | 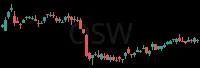 | Consumer Dis | 23.86 | 0.00% | 0.00 | 3.90 | 3.35 | 39% | 0 |
| OGN | 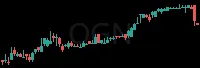 | Health Care | 13.74 | 0.00% | -0.01 | -12.98 | 1.47 | 40% | 0 |
| PUBM | 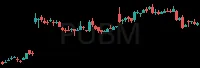 | Technology | 17.35 | +0.01% | +0.11 | 16.12 | 0.51 | 42% | 0 |
| LCLN | 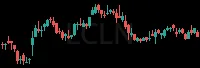 | Finance | 23.52 | 0.00% | 0.00 | -1.05 | 1.92 | 46% | 0 |
| EPRX | 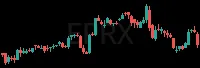 | Health Care | 6.99 | +0.02% | +0.12 | 10.23 | 0.47 | 48% | 0 |
| ASTH |  | Consumer Dis | 37.45 | 0.00% | 0.00 | 4.12 | 2.58 | 48% | 0 |
| REG |  | Real Estate | 73.98 | 0.00% | 0.00 | 1.52 | 4.97 | 52% | 0 |
| CSTL | 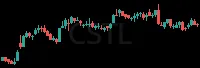 | Health Care | 33.08 | 0.00% | 0.00 | 1.46 | 2.45 | 54% | 0 |
| DV |  | Technology | 13.54 | 0.00% | -0.01 | 3.59 | 3.73 | 55% | 0 |
| PRVA | 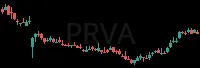 | Health Care | 22.41 | 0.00% | 0.00 | -4.13 | 5.67 | 55% | 0 |
| FOX |  | Telecommunic | 59.46 | 0.00% | 0.00 | -2.23 | 4.68 | 55% | 0 |
| MLKN | 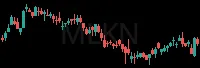 | Consumer Dis | 21.14 | 0.00% | 0.00 | -3.67 | 2.99 | 55% | 0 |
| FRPT | 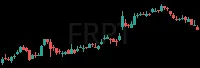 | Consumer Sta | 64.12 | 0.00% | 0.00 | -0.81 | 2.70 | 55% | 0 |
| L | 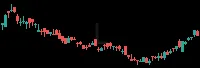 | Finance | 112.01 | 0.00% | 0.00 | -0.62 | 6.00 | 55% | 0 |
| EVER |  | Technology | 22.74 | 0.00% | 0.00 | -1.58 | 5.55 | 56% | 0 |
| TJX | 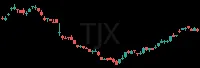 | Consumer Dis | 145.06 | 0.00% | 0.00 | -0.57 | 4.84 | 56% | 0 |
| GAP |  | Consumer Dis | 22.25 | 0.00% | -0.07 | -12.74 | 0.52 | 57% | 0 |
| EXPE | 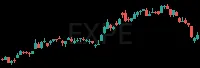 | Consumer Dis | 297.00 | +0.03% | +7.99 | 13.26 | 4.89 | 58% | 0 |
| JHX |  | Industrials | 26.15 | 0.00% | 0.00 | -2.81 | 4.25 | 58% | 0 |
| ARX | 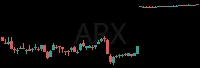 | Finance | 19.77 | 0.00% | 0.00 | 0.66 | 2.74 | 58% | 0 |
| NMAX |  | Industrials | 8.00 | +0.01% | +0.07 | 1.81 | -2.22 | 58% | 0 |
| MNRO | 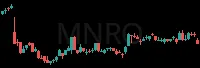 | Consumer Dis | 13.23 | 0.00% | 0.00 | -2.16 | 1.75 | 59% | 0 |
| TARS |  | Health Care | 68.20 | 0.00% | 0.00 | 2.63 | 0.83 | 60% | 0 |
| DRI |  | Consumer Dis | 212.40 | 0.00% | 0.00 | 3.14 | 4.67 | 60% | 0 |
| THC | 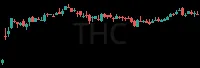 | Health Care | 268.45 | 0.00% | 0.00 | -1.72 | 3.68 | 60% | 0 |
| HP | 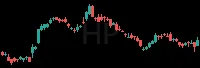 | Energy | 38.95 | 0.00% | 0.00 | 0.52 | 1.93 | 60% | 0 |
| OUT |  | Real Estate | 31.03 | 0.00% | 0.00 | -0.77 | 5.53 | 61% | 0 |
| CHEF |  | Consumer Dis | 105.50 | 0.00% | -0.38 | 1.36 | 1.04 | 62% | 0 |
| SVV |  | Consumer Dis | 9.37 | 0.00% | 0.00 | -0.37 | 2.78 | 62% | 0 |
| RAMP |  | Technology | 38.24 | 0.00% | 0.00 | 1.83 | 5.39 | 62% | 0 |
| LILAK |  | Telecommunic | 7.99 | 0.00% | 0.00 | -1.13 | -0.76 | 63% | 0 |
| MFC |  | Finance | 44.26 | 0.00% | 0.00 | -1.98 | 5.65 | 63% | 0 |
| EMBC | 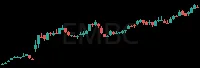 | Health Care | 6.71 | 0.00% | 0.00 | -2.62 | 5.18 | 63% | 0 |
| HIG | 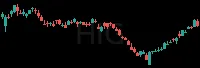 | Finance | 136.76 | 0.00% | 0.00 | -1.53 | 6.52 | 65% | 0 |
| AON |  | Finance | 303.52 | 0.00% | 0.00 | 3.82 | 7.34 | 65% | 0 |
| EXTR | 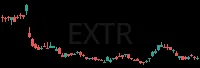 | Telecommunic | 22.39 | +0.02% | +0.42 | 5.51 | -0.78 | 65% | 0 |
| CNA | 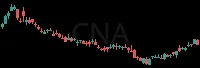 | Finance | 48.40 | 0.00% | 0.00 | 1.03 | 5.25 | 66% | 0 |
| CFR | 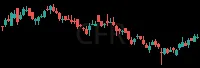 | Finance | 157.05 | 0.00% | 0.00 | -0.92 | 4.52 | 66% | 0 |
| PPLI | 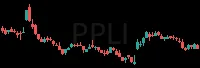 | Technology | 38.50 | 0.00% | 0.00 | -0.40 | 0.37 | 66% | 0 |
| SYY | 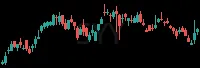 | Consumer Dis | 81.37 | 0.00% | 0.00 | -0.97 | 5.33 | 68% | 0 |
| REYN | 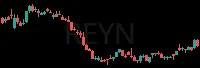 | Consumer Dis | 23.00 | 0.00% | -0.02 | -11.82 | 4.56 | 68% | 0 |
| PB |  | Finance | 69.60 | 0.00% | +0.10 | 0.73 | 5.48 | 69% | 0 |
| DNOW |  | Consumer Dis | 15.16 | -0.03% | -0.53 | 0.25 | 2.94 | 70% | 0 |
| HSIC | 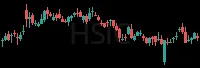 | Health Care | 84.96 | 0.00% | 0.00 | -2.08 | 3.02 | 73% | 0 |
| NI |  | Utilities | 43.28 | 0.00% | 0.00 | 2.19 | 5.97 | 73% | 0 |
| RVLV | 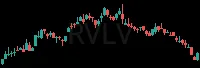 | Consumer Dis | 23.00 | +0.03% | +0.74 | 12.66 | 3.49 | 73% | 0 |
| VOYA |  | Finance | 95.81 | 0.00% | 0.00 | 1.67 | 1.95 | 74% | 0 |
| EFXT | 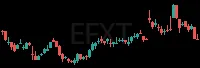 | Industrials | 22.75 | 0.00% | 0.00 | -1.08 | 1.75 | 74% | 0 |
| INGM |  | Technology | 27.69 | 0.00% | 0.00 | 1.43 | 2.44 | 74% | 0 |
| ATR |  | Industrials | 126.55 | 0.00% | 0.00 | -0.97 | 5.00 | 76% | 0 |
| SRE |  | Utilities | 84.06 | 0.00% | 0.00 | 0.51 | 5.62 | 76% | 0 |
| STLD |  | Industrials | 241.53 | 0.00% | 0.00 | -5.46 | 3.35 | 76% | 0 |
| MAX | 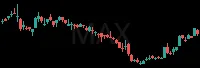 | Consumer Dis | 11.90 | 0.00% | 0.00 | 1.88 | 5.88 | 77% | 0 |
| NTGR |  | Utilities | 22.46 | 0.00% | 0.00 | -0.73 | 1.58 | 77% | 0 |
| WNC |  | Industrials | 12.87 | 0.00% | 0.00 | -1.96 | 0.95 | 77% | 0 |
| CAG |  | Consumer Sta | 14.87 | 0.00% | +0.01 | -1.00 | 5.77 | 78% | 0 |
| FSCO | 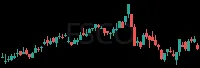 | Finance | 5.02 | 0.00% | 0.00 | 0.09 | 3.43 | 80% | 0 |
| BTSG |  | Health Care | 60.09 | 0.00% | -0.02 | 0.41 | 0.26 | 80% | 0 |
| SMPL |  | Consumer Sta | 10.41 | 0.00% | 0.00 | -0.93 | 3.65 | 83% | 0 |
| EHC | 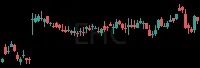 | Health Care | 124.09 | 0.00% | 0.00 | 1.83 | 2.88 | 84% | 0 |
| H | 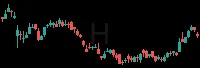 | Consumer Dis | 172.58 | 0.00% | 0.00 | -0.23 | 5.74 | 84% | 0 |
| DCTH | 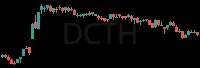 | Health Care | 14.42 | 0.00% | 0.00 | 2.35 | 0.54 | 85% | 0 |
| PFGC |  | Consumer Dis | 94.71 | 0.00% | 0.00 | 1.40 | 2.93 | 85% | 0 |
| GPN | 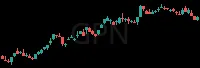 | Finance | 82.82 | 0.00% | 0.00 | -0.68 | 3.15 | 86% | 0 |
RS = relative strength vs SPY, in ATRs (1 hour / 2 weeks); green leads the market, red lags. RVOL = today's volume vs average. Prices are 15-minute delayed.
New here? How to trade these scans · More Pullbacks+Levels scans: Dead Cat Bounce · Bearish Pullback - Short · VWAP Pullbacks - Short · Bear Flag - Short · Near Day Low