All scans · Long

Momentum

Open live →

Low Float Momentum · 10 results · As of Sep 10, 2026 9:16 AM ET · 15-min delayed

Fast Moving · Laguerre RSI > .80 · Above yesterday's close · Float > 20M · Relative Volume > 4 · Relative Strength > .5

ZenBot is a free real-time scanner that surfaces the stocks in play — heavy volume, leading their sector, moving before the crowd. This is one of its built-in scans.
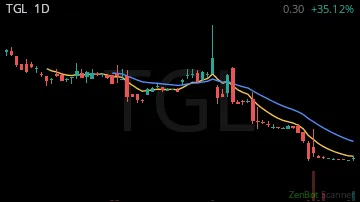
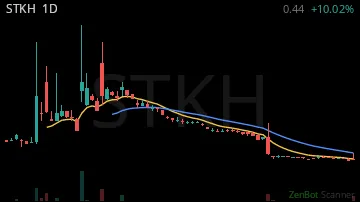
SymbolChartSectorLastChg %Chg $RS 1HRS 2WRVOLVol
TNONTNON daily chartHealth Care4.27+0.75%+1.837.45-6.11730%21.0M
SNYRSNYR daily chartHealth Care0.12+0.46%+0.041.92-0.53800%154.9M
TNONWTNONW daily chartHealth Care0.02+1.03%+0.014.800.251,201%225.1K
TPETTPET daily chartEnergy2.06+0.14%+0.256.688.201,719%5.1M
JZJZ daily chartReal Estate0.91+0.15%+0.124.06-4.051,776%8.1M
PCLAPCLA daily chartConsumer Dis9.12+0.23%+1.704.750.402,466%1.6M
SLXNSLXN daily chartHealth Care0.40+0.14%+0.054.65-1.063,709%56.3M
AEONAEON daily chartHealth Care0.30+0.31%+0.072.271.6710,720%96.4M
IPDNIPDN daily chartTechnology0.18+0.43%+0.054.39-0.4026,125%211.0M
CULPCULP daily chartConsumer Dis4.10+0.17%+0.615.031.1910,731,709%552.8K

RS = relative strength vs SPY, in ATRs (1 hour / 2 weeks); green leads the market, red lags. RVOL = today's volume vs average. Prices are 15-minute delayed.

New here? How to trade these scans · More Top Scans scans: Trending Now - Long · In Play · Halted Now · Halt Resumed · Top Longs · Ready to Trend - Long

Open Momentum live →