All scans · Long
Earnings Soon - Long
Open live →ZenBot is a free real-time scanner that surfaces the stocks in play — heavy volume, leading their sector, moving before the crowd. This is one of its built-in scans.
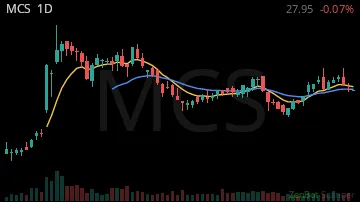
MCS27.95 0.00%
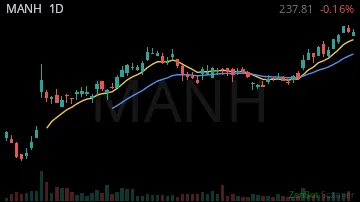
MANH238.50 0.00%
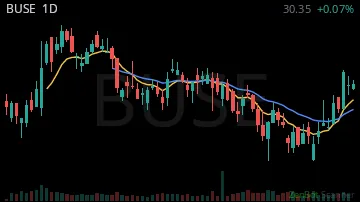
BUSE30.43 0.00%
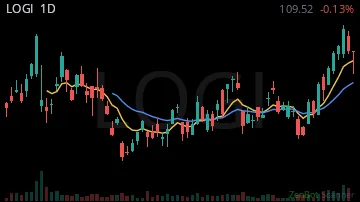
LOGI108.76 -0.01%
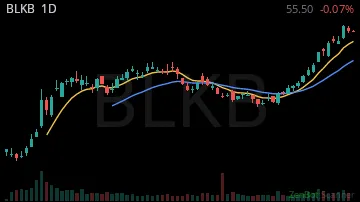
BLKB55.50 0.00%
ACA149.50 0.00%

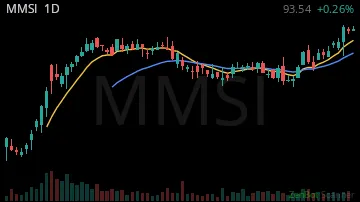
MMSI93.50 0.00%
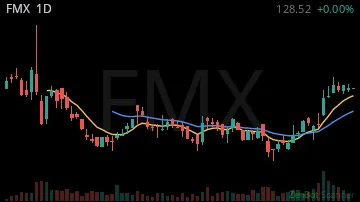
FMX128.52 0.00%
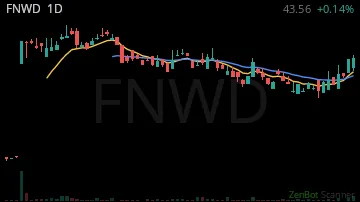
FNWD43.56 0.00%
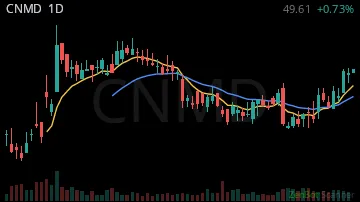
CNMD49.26 0.00%
LYB66.02 -0.01%

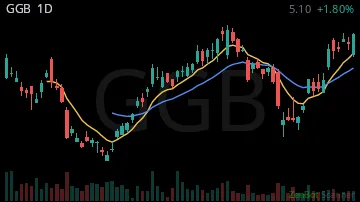
GGB4.40 -0.14%
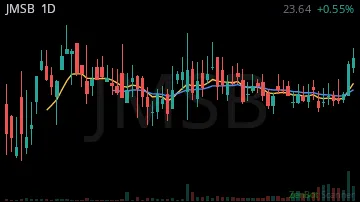
JMSB23.64 0.00%
ATEC11.15 0.00%

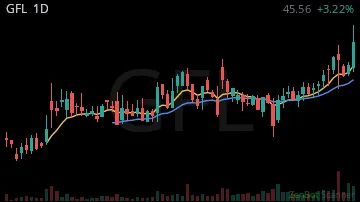
GFL45.53 0.00%
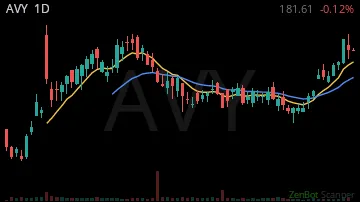
AVY181.61 0.00%
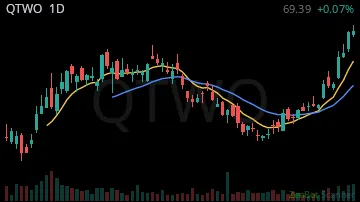
QTWO69.39 0.00%
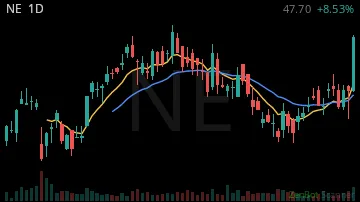
NE47.60 0.00%
XOM180.56 -0.01%

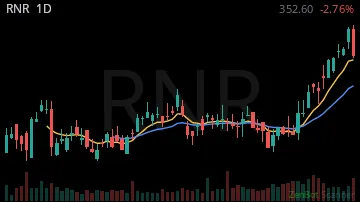
RNR352.60 0.00%
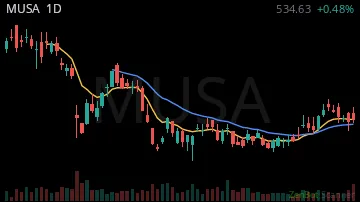
MUSA534.63 0.00%
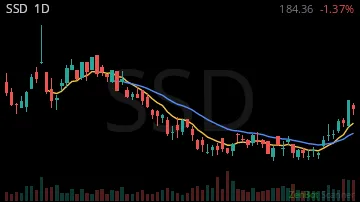
SSD184.36 0.00%
FTV60.25 0.00%

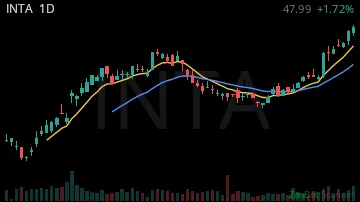
INTA47.99 0.00%
EQNR47.77 -0.02%

RES6.29 +0.01%

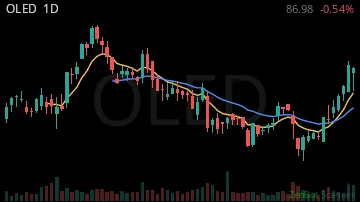
OLED86.98 0.00%
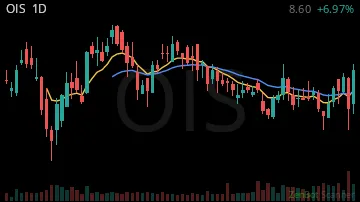
OIS7.89 -0.08%
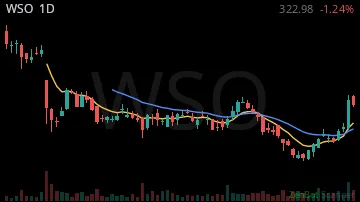
WSO322.98 0.00%
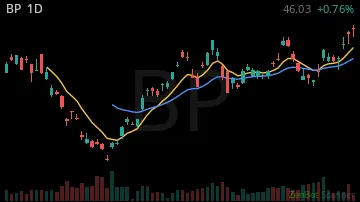
BP50.49 -0.02%
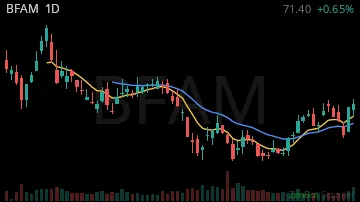
BFAM71.40 0.00%
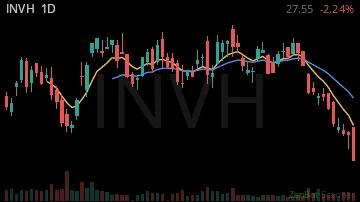
INVH27.54 0.00%
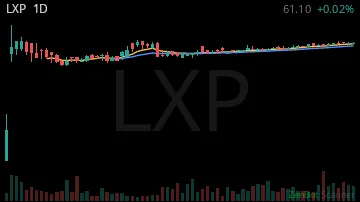
LXP61.10 0.00%
PYPL56.96 0.00%

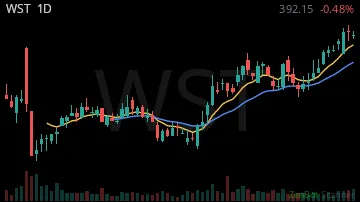
WST391.09 0.00%
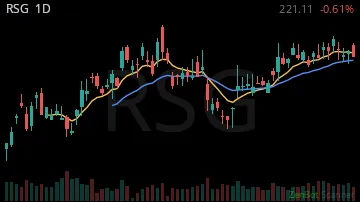
RSG240.45 0.00%
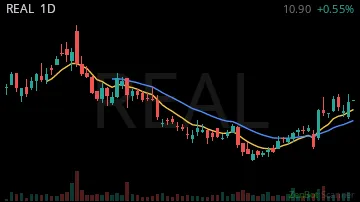
REAL10.84 0.00%
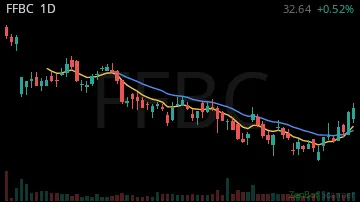
FFBC32.64 0.00%
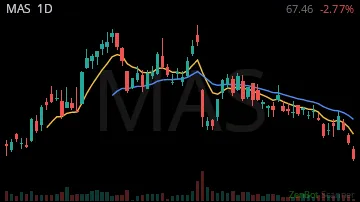
MAS76.01 0.00%
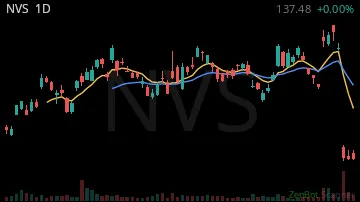
NVS154.73 +0.02%
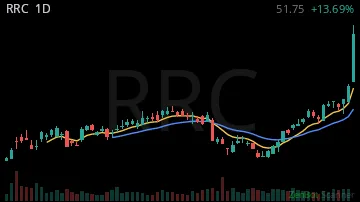
RRC45.26 -0.01%
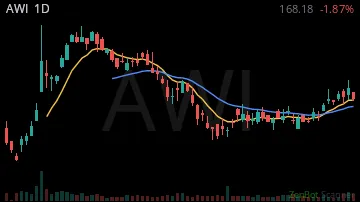
AWI168.18 0.00%
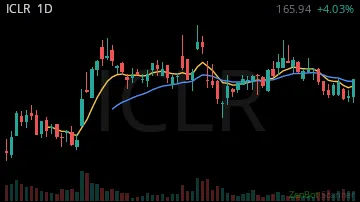
ICLR185.27 0.00%
HIW30.51 0.00%

CVX231.41 -0.01%

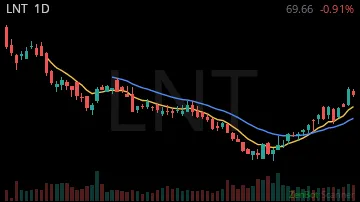
LNT69.66 0.00%
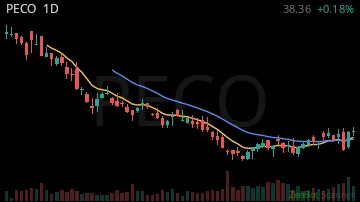
PECO38.36 0.00%
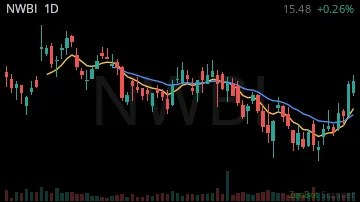
NWBI15.48 0.00%
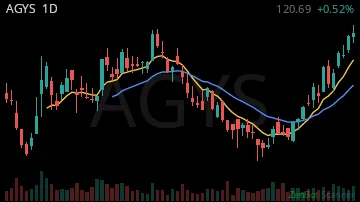
AGYS120.69 0.00%
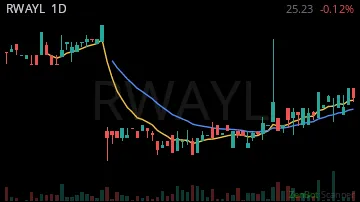
RWAYL25.23 0.00%
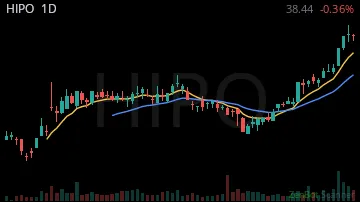
HIPO38.44 0.00%
KIM23.62 0.00%

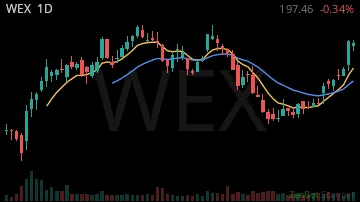
WEX197.46 0.00%
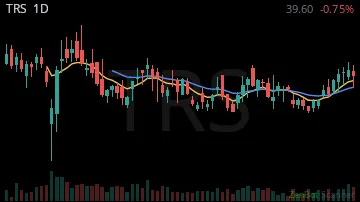
TRS39.60 0.00%
OI6.47 0.00%

TRU80.07 -0.02%

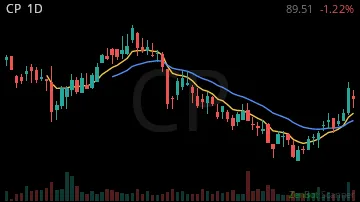
CP89.51 0.00%
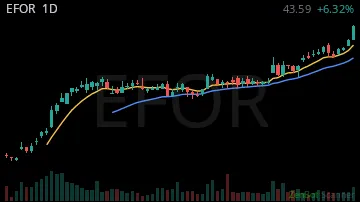
EFOR43.59 0.00%
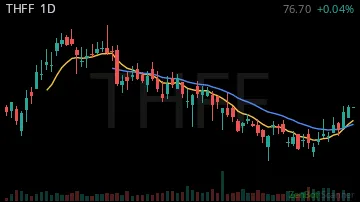
THFF76.70 0.00%
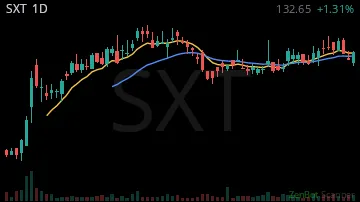
SXT132.80 0.00%
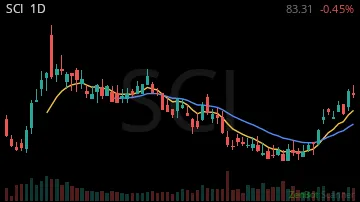
SCI83.59 0.00%
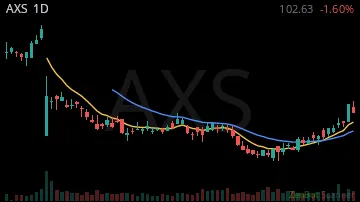
AXS102.63 0.00%
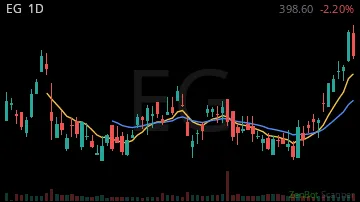
EG398.60 0.00%
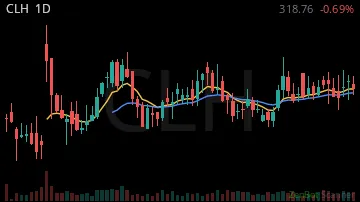
CLH319.00 0.00%
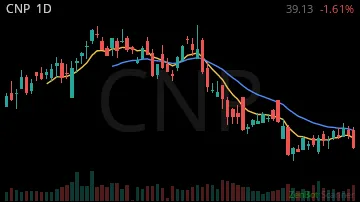
CNP41.07 0.00%
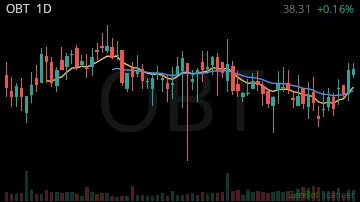
OBT38.31 0.00%
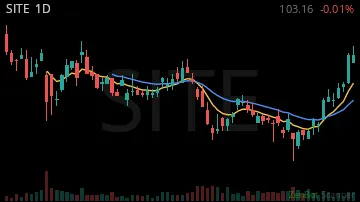
SITE103.16 0.00%
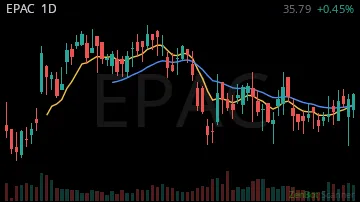
EPAC35.79 0.00%
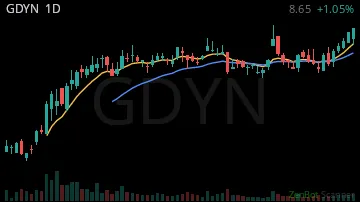
GDYN8.65 0.00%
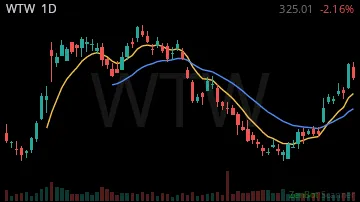
WTW325.14 0.00%
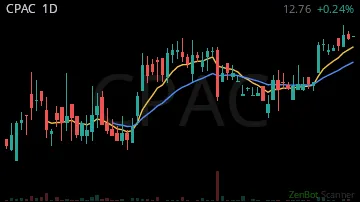
CPAC12.73 0.00%
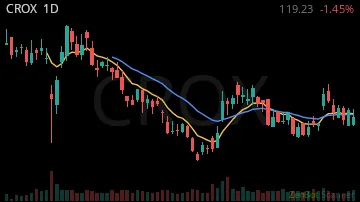
CROX119.15 0.00%
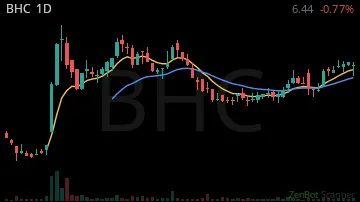
BHC6.44 0.00%
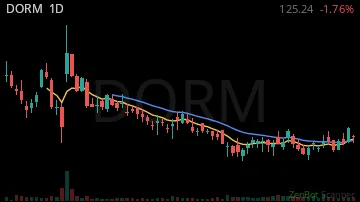
DORM125.59 0.00%
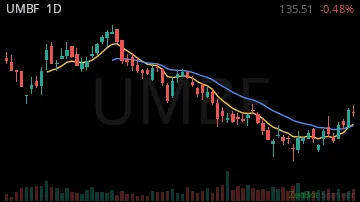
UMBF135.51 0.00%
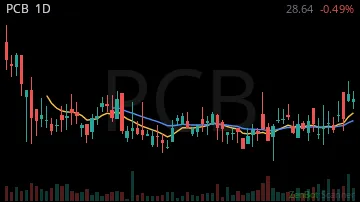
PCB28.64 0.00%
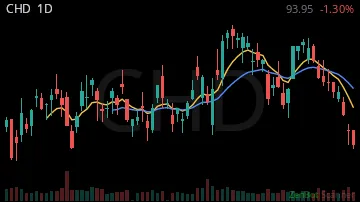
CHD105.30 0.00%
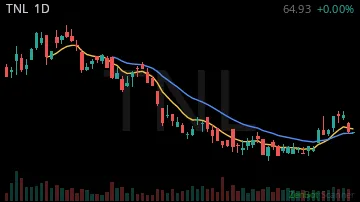
TNL64.98 0.00%
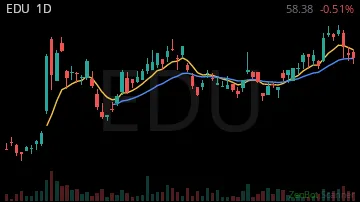
EDU58.38 0.00%
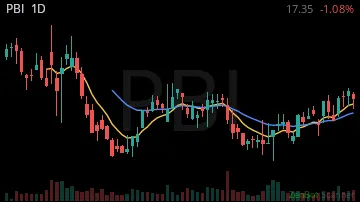
PBI17.35 0.00%
AWK142.65 0.00%

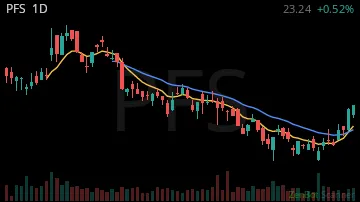
PFS23.24 0.00%
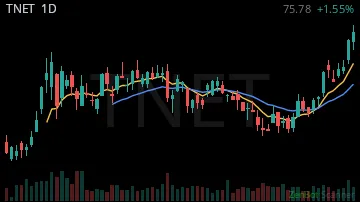
TNET75.78 0.00%
ORLY90.01 0.00%

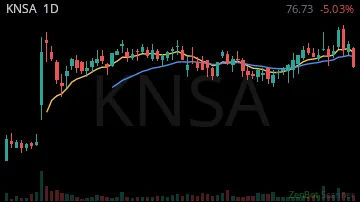
KNSA74.70 -0.03%
CNC70.17 0.00%

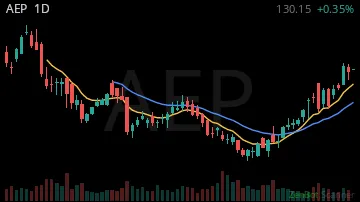
AEP130.15 0.00%
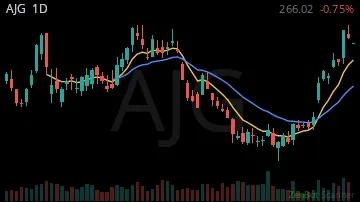
AJG266.02 -0.01%
AMRZ39.67 +0.01%

AR39.96 0.00%

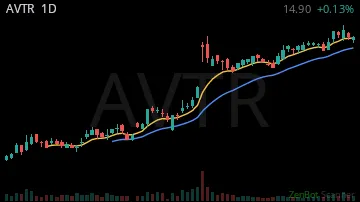
AVTR17.40 +0.01%
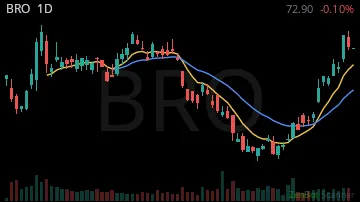
BRO72.90 0.00%
BSX45.70 0.00%

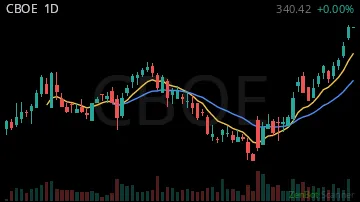
CBOE340.42 0.00%
CCC7.64 0.00%

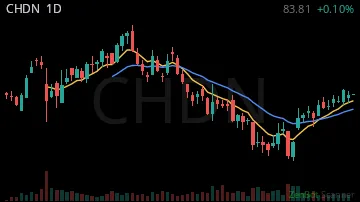
CHDN83.81 0.00%
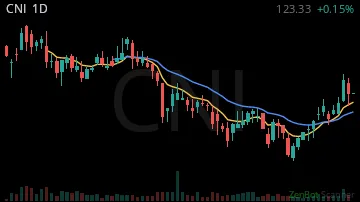
CNI123.33 0.00%
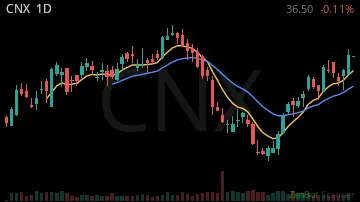
CNX36.50 0.00%
CRH84.87 0.00%

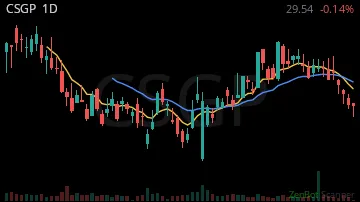
CSGP33.97 0.00%
| Symbol | Chart | Sector | Last | Chg % | Chg $ | RS 1H | RS 2W | RVOL | Vol |
|---|---|---|---|---|---|---|---|---|---|
| MCS |  | Consumer Dis | 27.95 | 0.00% | -0.02 | -15.22 | 4.11 | 10,294% | 175 |
| MANH | 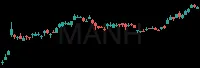 | Technology | 238.50 | 0.00% | +0.31 | -3.13 | 7.03 | 2,057% | 7.7K |
| BUSE | 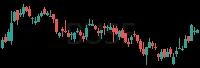 | Finance | 30.43 | 0.00% | +0.10 | 4.90 | 4.87 | 1,727% | 781 |
| LOGI | 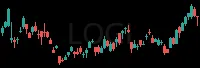 | Technology | 108.76 | -0.01% | -0.90 | -2.90 | 4.80 | 678% | 2.7K |
| BLKB | 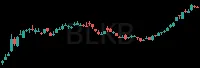 | Technology | 55.50 | 0.00% | -0.04 | -4.09 | 8.37 | 673% | 1.9K |
| ACA |  | Industrials | 149.50 | 0.00% | +0.35 | -1.73 | 6.82 | 520% | 0 |
| MMSI | 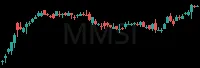 | Health Care | 93.50 | 0.00% | +0.20 | -1.61 | 5.89 | 434% | 2.8K |
| FMX | 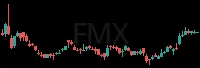 | Consumer Sta | 128.52 | 0.00% | 0.00 | 0.00 | 6.36 | 300% | 940 |
| FNWD | 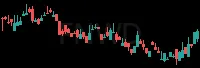 | Finance | 43.56 | 0.00% | 0.00 | 0.19 | 4.99 | 288% | 0 |
| CNMD | 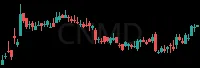 | Health Care | 49.26 | 0.00% | +0.01 | 9.27 | 5.41 | 285% | 804 |
| LYB |  | Industrials | 66.02 | -0.01% | -0.43 | -1.25 | 6.92 | 277% | 690 |
| GGB |  | Industrials | 4.40 | -0.14% | -0.70 | 0.75 | 2.94 | 265% | 23.8K |
| JMSB | 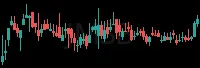 | Finance | 23.64 | 0.00% | 0.00 | 1.88 | 4.51 | 242% | 0 |
| ATEC | 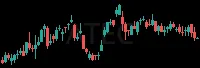 | Health Care | 11.15 | 0.00% | +0.04 | -3.39 | 4.09 | 189% | 7.5K |
| GFL | 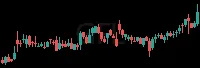 | Utilities | 45.53 | 0.00% | -0.03 | 1.07 | 5.17 | 186% | 0 |
| AVY | 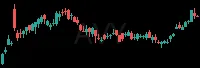 | Consumer Dis | 181.61 | 0.00% | -0.22 | -5.88 | 6.50 | 184% | 881 |
| QTWO | 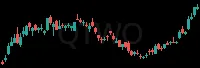 | Technology | 69.39 | 0.00% | 0.00 | 0.14 | 8.42 | 179% | 0 |
| NE | 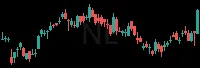 | Energy | 47.60 | 0.00% | -0.10 | -14.01 | 6.30 | 175% | 0 |
| XOM | 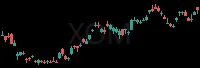 | Energy | 180.56 | -0.01% | -2.65 | -10.86 | 7.19 | 172% | 22.9K |
| RNR | 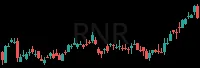 | Finance | 352.60 | 0.00% | 0.00 | 1.86 | 6.29 | 162% | 0 |
| MUSA | 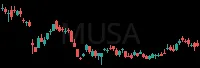 | Consumer Dis | 534.63 | 0.00% | 0.00 | 0.76 | 3.91 | 160% | 0 |
| SSD | 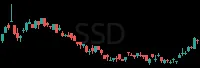 | Consumer Dis | 184.36 | 0.00% | 0.00 | -1.49 | 5.69 | 159% | 0 |
| FTV |  | Industrials | 60.25 | 0.00% | 0.00 | 0.28 | 5.49 | 156% | 0 |
| INTA | 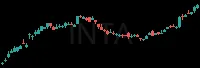 | Technology | 47.99 | 0.00% | 0.00 | 0.19 | 8.58 | 155% | 0 |
| EQNR | 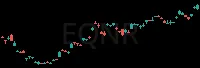 | Energy | 47.77 | -0.02% | -1.05 | -9.22 | 7.39 | 154% | 39.3K |
| RES |  | Energy | 6.29 | +0.01% | +0.04 | 5.49 | 3.77 | 152% | 0 |
| OLED | 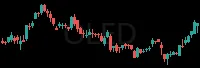 | Technology | 86.98 | 0.00% | 0.00 | 5.46 | 5.11 | 149% | 0 |
| OIS | 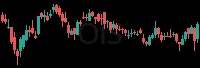 | Consumer Dis | 7.89 | -0.08% | -0.71 | -9.84 | 3.85 | 143% | 0 |
| WSO | 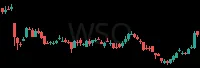 | Consumer Dis | 322.98 | 0.00% | 0.00 | 2.35 | 6.59 | 135% | 0 |
| BP | 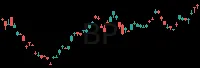 | Energy | 50.49 | -0.02% | -0.83 | -9.59 | 7.89 | 135% | 61.3K |
| BFAM |  | Consumer Dis | 71.40 | 0.00% | 0.00 | 1.46 | 4.40 | 134% | 0 |
| INVH |  | Finance | 27.54 | 0.00% | 0.00 | 0.86 | 5.70 | 133% | 0 |
| LXP |  | Real Estate | 61.10 | 0.00% | 0.00 | 0.73 | 4.44 | 130% | 0 |
| PYPL |  | Finance | 56.96 | 0.00% | -0.06 | 0.04 | 4.33 | 130% | 13.1K |
| WST |  | Health Care | 391.09 | 0.00% | -1.06 | 1.69 | 5.59 | 129% | 0 |
| RSG |  | Utilities | 240.45 | 0.00% | 0.00 | 2.18 | 7.70 | 128% | 0 |
| REAL |  | Consumer Dis | 10.84 | 0.00% | 0.00 | -2.78 | 4.86 | 127% | 0 |
| FFBC | 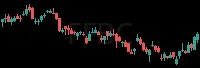 | Finance | 32.64 | 0.00% | 0.00 | -0.73 | 5.24 | 125% | 0 |
| MAS |  | Industrials | 76.01 | 0.00% | 0.00 | -2.04 | 5.74 | 124% | 0 |
| NVS | 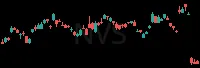 | Health Care | 154.73 | +0.02% | +3.61 | -0.56 | 5.16 | 121% | 21.0K |
| RRC | 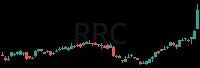 | Energy | 45.26 | -0.01% | -0.26 | -5.90 | 7.16 | 120% | 0 |
| AWI | 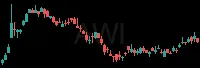 | Industrials | 168.18 | 0.00% | 0.00 | -0.08 | 4.14 | 120% | 0 |
| ICLR | 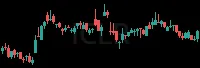 | Health Care | 185.27 | 0.00% | 0.00 | 3.11 | 4.99 | 120% | 0 |
| HIW |  | Real Estate | 30.51 | 0.00% | 0.00 | -2.69 | 3.66 | 119% | 0 |
| CVX | 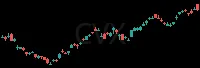 | Energy | 231.41 | -0.01% | -1.80 | -7.58 | 7.92 | 119% | 10.1K |
| LNT | 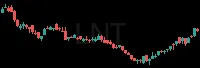 | Utilities | 69.66 | 0.00% | 0.00 | 0.06 | 6.20 | 119% | 0 |
| PECO | 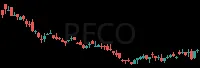 | Real Estate | 38.36 | 0.00% | 0.00 | 3.98 | 4.26 | 119% | 0 |
| NWBI |  | Finance | 15.48 | 0.00% | 0.00 | 2.07 | 5.18 | 118% | 0 |
| AGYS | 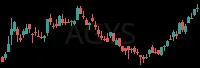 | Technology | 120.69 | 0.00% | 0.00 | -0.62 | 6.88 | 118% | 0 |
| RWAYL | 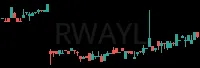 | Finance | 25.23 | 0.00% | 0.00 | 1.52 | 3.14 | 116% | 0 |
| HIPO | 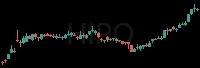 | Finance | 38.44 | 0.00% | 0.00 | 2.90 | 7.89 | 115% | 0 |
| KIM | 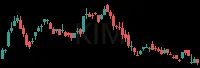 | Real Estate | 23.62 | 0.00% | 0.00 | 3.26 | 6.82 | 115% | 0 |
| WEX | 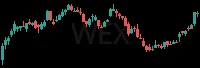 | Consumer Dis | 197.46 | 0.00% | 0.00 | -0.56 | 8.08 | 115% | 0 |
| TRS |  | Industrials | 39.60 | 0.00% | 0.00 | -1.79 | 4.21 | 115% | 0 |
| OI |  | Consumer Dis | 6.47 | 0.00% | 0.00 | 2.37 | 4.82 | 113% | 0 |
| TRU |  | Finance | 80.07 | -0.02% | -1.41 | -5.02 | 8.00 | 113% | 0 |
| CP | 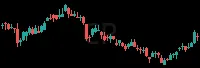 | Industrials | 89.51 | 0.00% | 0.00 | -2.42 | 6.06 | 113% | 0 |
| EFOR | 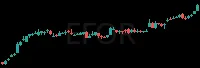 | Consumer Dis | 43.59 | 0.00% | 0.00 | 3.38 | 7.34 | 113% | 0 |
| THFF | 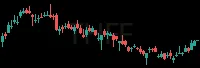 | Finance | 76.70 | 0.00% | +0.03 | -3.20 | 4.66 | 113% | 216 |
| SXT | 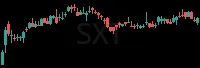 | Industrials | 132.80 | 0.00% | +0.15 | 13.18 | 2.59 | 112% | 0 |
| SCI | 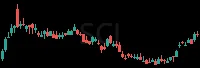 | Consumer Dis | 83.59 | 0.00% | +0.28 | 1.01 | 6.59 | 112% | 0 |
| AXS | 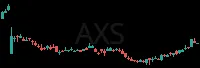 | Finance | 102.63 | 0.00% | 0.00 | -0.56 | 6.12 | 112% | 0 |
| EG |  | Finance | 398.60 | 0.00% | 0.00 | 0.00 | 6.66 | 112% | 0 |
| CLH |  | Industrials | 319.00 | 0.00% | +0.24 | 4.68 | 2.93 | 110% | 0 |
| CNP |  | Utilities | 41.07 | 0.00% | 0.00 | 0.69 | 6.13 | 110% | 0 |
| OBT |  | Finance | 38.31 | 0.00% | 0.00 | 4.63 | 3.62 | 109% | 0 |
| SITE | 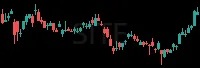 | Consumer Dis | 103.16 | 0.00% | 0.00 | -3.62 | 7.28 | 109% | 0 |
| EPAC | 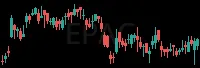 | Technology | 35.79 | 0.00% | 0.00 | 3.92 | 3.29 | 108% | 0 |
| GDYN | 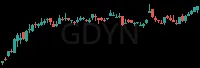 | Technology | 8.65 | 0.00% | 0.00 | 6.11 | 5.32 | 108% | 0 |
| WTW | 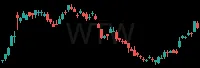 | Finance | 325.14 | 0.00% | +0.13 | 1.57 | 6.74 | 107% | 0 |
| CPAC | 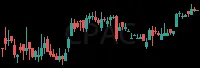 | Industrials | 12.73 | 0.00% | 0.00 | 0.02 | 5.53 | 107% | 0 |
| CROX | 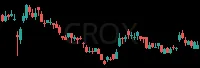 | Consumer Dis | 119.15 | 0.00% | -0.08 | 3.22 | 3.35 | 107% | 0 |
| BHC | 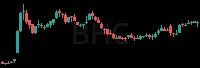 | Health Care | 6.44 | 0.00% | 0.00 | 0.46 | 3.55 | 106% | 0 |
| DORM | 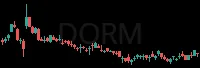 | Consumer Dis | 125.59 | 0.00% | +0.35 | 4.15 | 3.09 | 106% | 0 |
| UMBF | 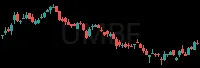 | Finance | 135.51 | 0.00% | 0.00 | -1.15 | 4.84 | 106% | 0 |
| PCB | 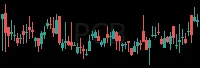 | Finance | 28.64 | 0.00% | 0.00 | 0.27 | 3.75 | 105% | 0 |
| CHD | 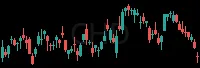 | Consumer Dis | 105.30 | 0.00% | +0.11 | -0.11 | 6.25 | 105% | 0 |
| TNL | 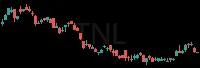 | Consumer Dis | 64.98 | 0.00% | +0.05 | 2.37 | 3.67 | 105% | 0 |
| EDU | 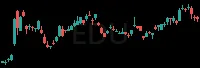 | Real Estate | 58.38 | 0.00% | 0.00 | -0.71 | 3.07 | 105% | 0 |
| PBI | 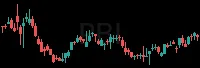 | Miscellaneou | 17.35 | 0.00% | 0.00 | 2.45 | 4.44 | 102% | 0 |
| AWK |  | Utilities | 142.65 | 0.00% | -0.10 | 3.12 | 7.44 | 102% | 0 |
| PFS | 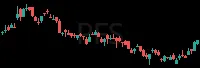 | Finance | 23.24 | 0.00% | 0.00 | 5.73 | 5.75 | 101% | 0 |
| TNET | 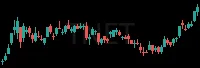 | Consumer Dis | 75.78 | 0.00% | 0.00 | 2.36 | 7.06 | 101% | 0 |
| ORLY |  | Consumer Dis | 90.01 | 0.00% | +0.09 | -12.66 | 5.30 | 100% | 0 |
| KNSA | 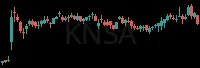 | Health Care | 74.70 | -0.03% | -2.03 | 0.77 | 2.02 | 100% | 0 |
| CNC | 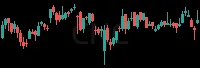 | Health Care | 70.17 | 0.00% | 0.00 | -2.43 | 4.69 | 100% | 0 |
| AEP | 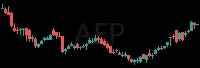 | Utilities | 130.15 | 0.00% | +0.46 | 13.58 | 5.56 | 100% | 322 |
| AJG | 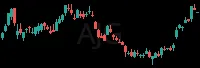 | Finance | 266.02 | -0.01% | -2.02 | -12.42 | 8.43 | 100% | 100 |
| AMRZ |  | Industrials | 39.67 | +0.01% | +0.23 | -0.34 | 5.88 | 100% | 1.4K |
| AR |  | Energy | 39.96 | 0.00% | -0.20 | -11.33 | 6.19 | 100% | 469 |
| AVTR |  | Industrials | 17.40 | +0.01% | +0.11 | 0.50 | 6.50 | 100% | 397 |
| BRO | 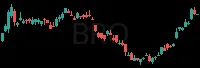 | Finance | 72.90 | 0.00% | -0.07 | -17.72 | 8.05 | 100% | 148 |
| BSX |  | Health Care | 45.70 | 0.00% | +0.01 | -3.77 | 5.70 | 100% | 4.6K |
| CBOE | 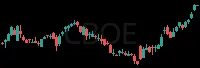 | Finance | 340.42 | 0.00% | 0.00 | 10.90 | 7.42 | 100% | 125 |
| CCC | 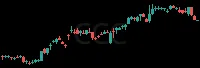 | Technology | 7.64 | 0.00% | -0.03 | -2.62 | 7.99 | 100% | 1.0K |
| CHDN | 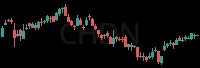 | Consumer Dis | 83.81 | 0.00% | +0.08 | 11.42 | 6.22 | 100% | 1.1K |
| CNI | 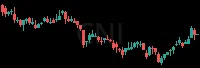 | Industrials | 123.33 | 0.00% | +0.18 | 8.28 | 5.73 | 100% | 482 |
| CNX | 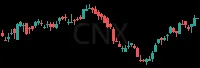 | Energy | 36.50 | 0.00% | -0.04 | -14.96 | 5.27 | 100% | 301 |
| CRH |  | Industrials | 84.87 | 0.00% | -0.02 | -15.06 | 3.98 | 100% | 245 |
| CSGP | 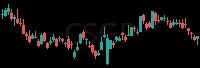 | Finance | 33.97 | 0.00% | +0.05 | 2.30 | 7.15 | 100% | 498 |
RS = relative strength vs SPY, in ATRs (1 hour / 2 weeks); green leads the market, red lags. RVOL = today's volume vs average. Prices are 15-minute delayed.
New here? How to trade these scans · More News+Earnings scans: Up On News · After Earnings - Long · Earnings Winners