All scans · Long
Leaders on Sale
Open live →ZenBot is a free real-time scanner that surfaces the stocks in play — heavy volume, leading their sector, moving before the crowd. This is one of its built-in scans.
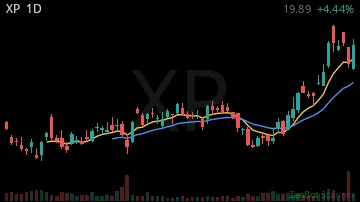
XP16.33 -0.46%
STNE7.44 -0.35%

ITUB6.99 -0.28%

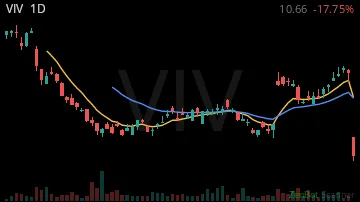
VIV10.66 -0.18%
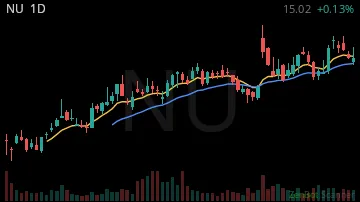
NU11.65 -0.23%
AMX24.24 -0.01%

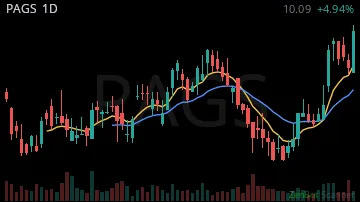
PAGS8.10 -0.29%
DLO13.70 -0.09%
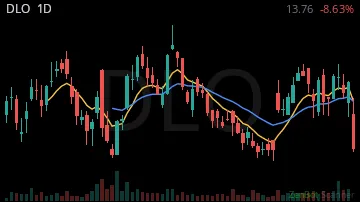
ARCO7.25 -0.10%

PBR20.50 -0.22%
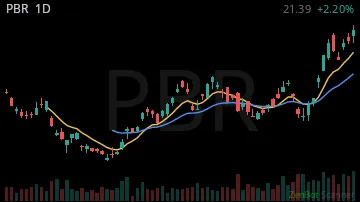
UGP6.29 -0.19%

EMBJ68.07 -0.04%
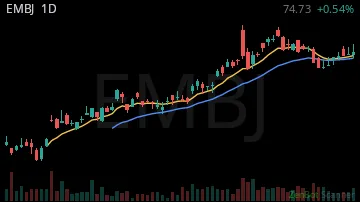
BUD81.62 -0.03%

BNC5.44 +0.02%

LNTH99.61 0.00%
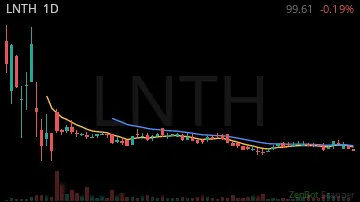
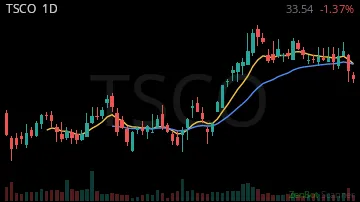
TSCO33.19 -0.01%
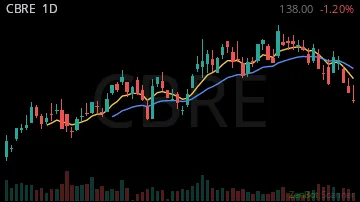
CBRE123.30 0.00%
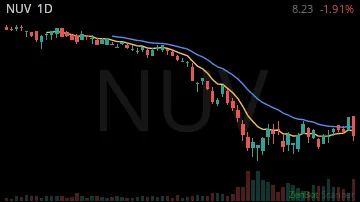
NUV8.26 0.00%
CRBG34.13 0.00%

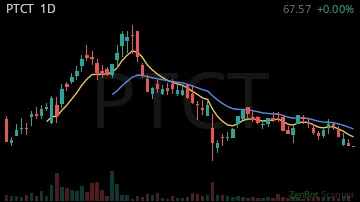
PTCT60.59 0.00%
AFRM70.45 +0.01%

ATEC11.15 0.00%

WH72.42 0.00%

AAPL343.15 -0.01%
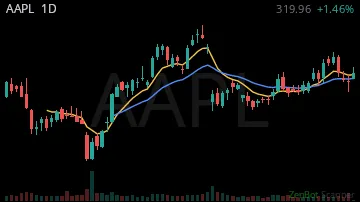
GNTX20.69 0.00%

ZGN13.48 0.00%
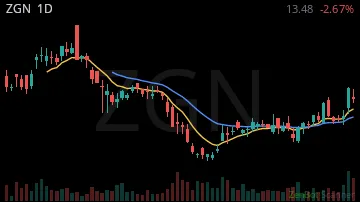
COCO56.53 0.00%

BLMN9.22 0.00%
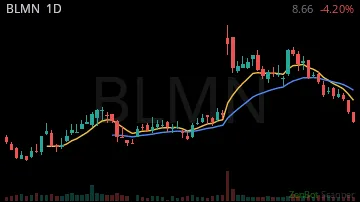
NAMS19.71 0.00%

QXO10.51 0.00%

DAN26.83 0.00%
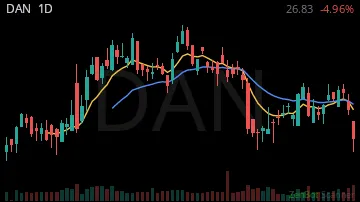
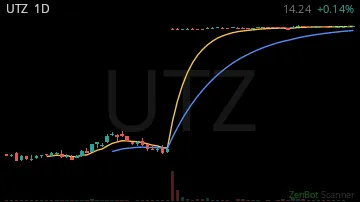
UTZ14.28 0.00%
ROKU158.99 0.00%

HE8.45 0.00%

KNX61.21 0.00%

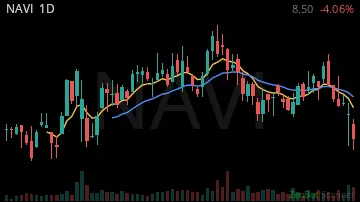
NAVI8.46 -0.01%
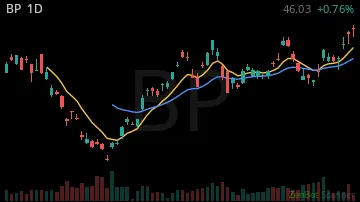
BP50.49 -0.02%
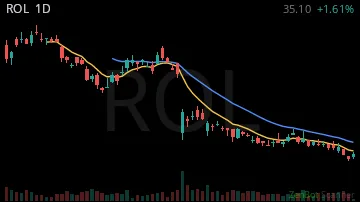
ROL34.78 0.00%
KLRA12.60 -0.02%

PYPL56.96 0.00%

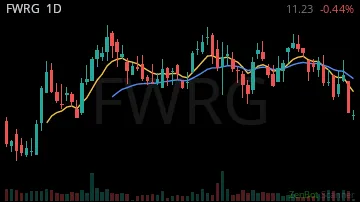
FWRG10.89 0.00%
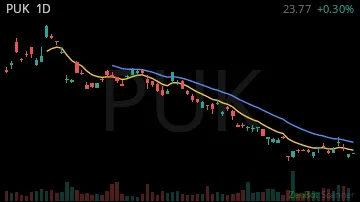
PUK23.70 0.00%
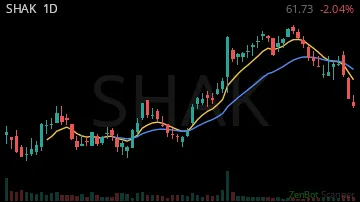
SHAK65.16 0.00%
NAD10.32 0.00%

OSCR31.01 0.00%

ASST28.32 -0.02%

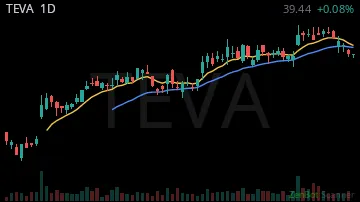
TEVA39.45 0.00%
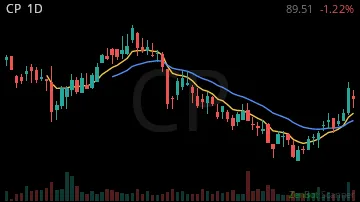
CP89.51 0.00%
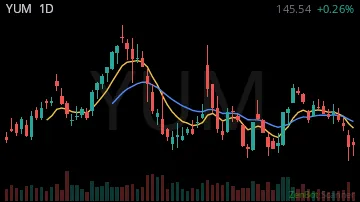
YUM149.70 0.00%
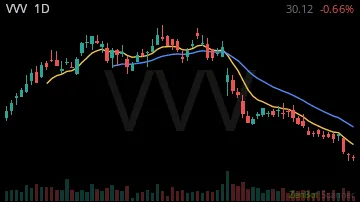
VVV31.55 0.00%
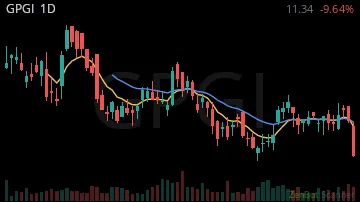
GPGI11.30 0.00%
MRNA188.94 -0.06%

NSC331.00 0.00%

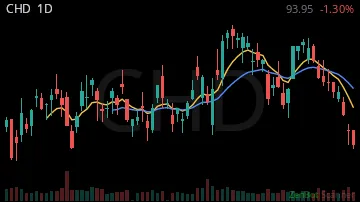
CHD105.30 0.00%
AS28.24 0.00%

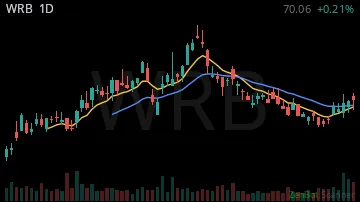
WRB73.33 0.00%
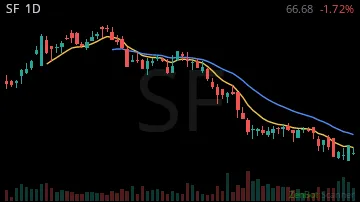
SF66.68 0.00%
ORLY90.01 0.00%

CNC70.17 0.00%

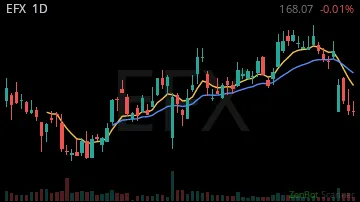
EFX181.50 0.00%
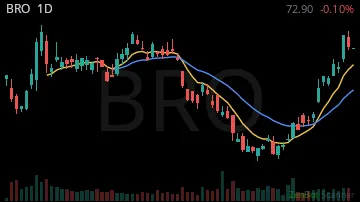
BRO72.90 0.00%
EXLS42.66 +0.01%

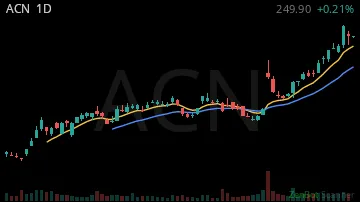
ACN248.00 -0.01%
KMB109.54 -0.01%

MA624.88 0.00%

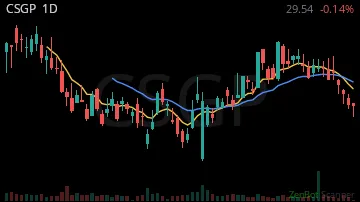
CSGP33.97 0.00%
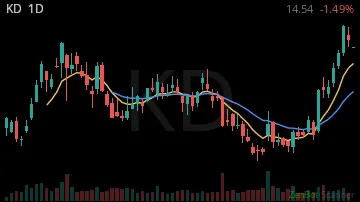
KD14.54 -0.01%
BALL64.56 0.00%

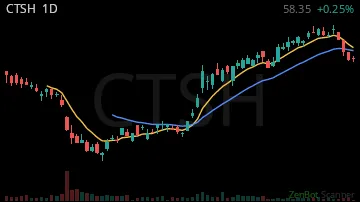
CTSH70.68 0.00%
PLNT52.69 0.00%

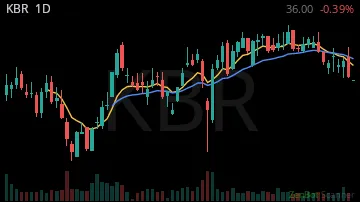
KBR39.04 0.00%
SHO12.64 +0.01%

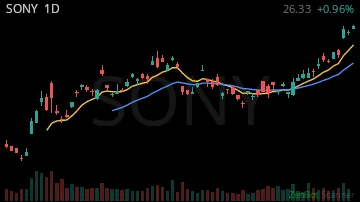
SONY26.33 +0.01%
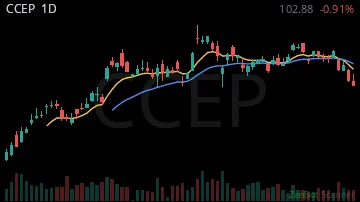
CCEP111.42 +0.01%
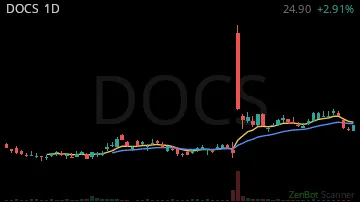
DOCS33.30 0.00%
PG161.59 0.00%

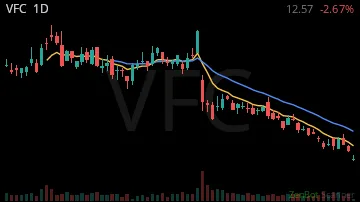
VFC17.27 0.00%
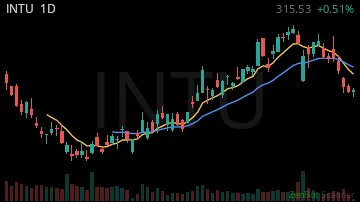
INTU343.75 0.00%
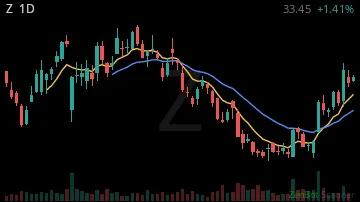
Z33.19 +0.01%
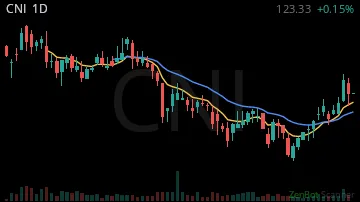
CNI123.33 0.00%
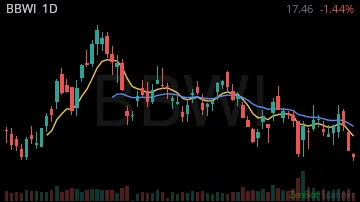
BBWI20.95 0.00%
AMRZ39.67 +0.01%

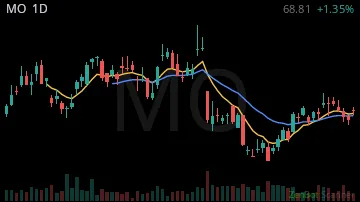
MO74.43 0.00%
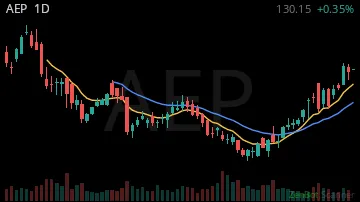
AEP130.15 0.00%
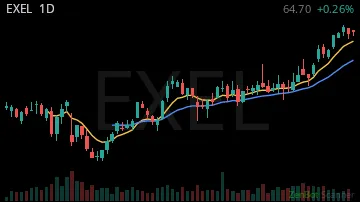
EXEL64.95 +0.01%
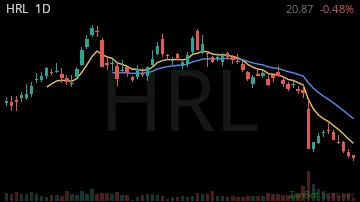
HRL21.10 0.00%
GO13.51 +0.02%

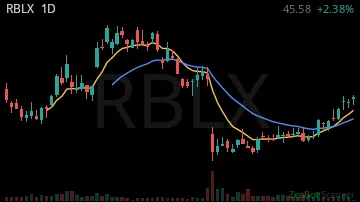
RBLX52.70 0.00%
DKS144.24 0.00%

CPB20.76 0.00%

HSY170.00 0.00%

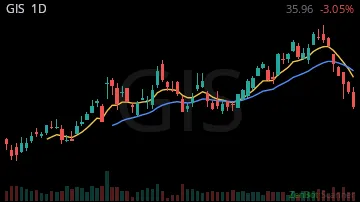
GIS34.42 0.00%
CI306.95 0.00%

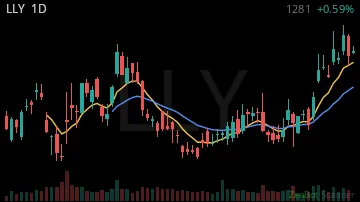
LLY1284.20 +0.01%
FITB52.51 -0.01%

PEB20.55 +0.01%

SYRE90.05 0.00%

CVS93.68 0.00%

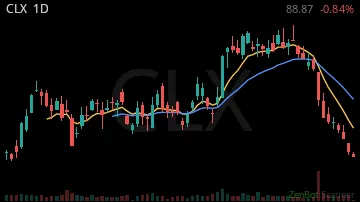
CLX86.52 0.00%
PK16.35 0.00%

| Symbol | Chart | Sector | Last | Chg % | Chg $ | RS 1H | RS 2W | RVOL | Vol |
|---|---|---|---|---|---|---|---|---|---|
| XP |  | Finance | 16.33 | -0.46% | -14.09 | -6.04 | 3.01 | 30,262% | 1.2M |
| STNE |  | Technology | 7.44 | -0.35% | -4.04 | -7.16 | 2.34 | 15,275% | 732.5K |
| ITUB |  | Finance | 6.99 | -0.28% | -2.68 | -3.16 | 2.15 | 8,514% | 799.4K |
| VIV |  | Telecommunic | 10.66 | -0.18% | -2.30 | -5.61 | 3.24 | 6,606% | 19.3K |
| NU |  | Finance | 11.65 | -0.23% | -3.51 | -2.81 | 1.64 | 6,113% | 5.3M |
| AMX |  | Telecommunic | 24.24 | -0.01% | -0.33 | -14.65 | 5.91 | 4,711% | 2.6K |
| PAGS |  | Technology | 8.10 | -0.29% | -3.34 | -3.26 | 4.58 | 3,946% | 165.1K |
| DLO | 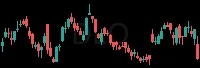 | Consumer Dis | 13.70 | -0.09% | -1.36 | -5.55 | 2.95 | 3,700% | 40.7K |
| ARCO | 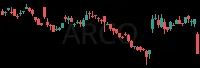 | Consumer Dis | 7.25 | -0.10% | -0.84 | -8.06 | 3.12 | 3,348% | 14.0K |
| PBR |  | Energy | 20.50 | -0.22% | -5.66 | -6.05 | 5.33 | 1,296% | 806.1K |
| UGP | 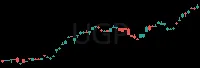 | Utilities | 6.29 | -0.19% | -1.45 | -4.21 | 2.39 | 977% | 24.4K |
| EMBJ | 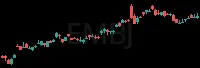 | Industrials | 68.07 | -0.04% | -2.77 | -7.37 | 1.94 | 687% | 4.1K |
| BUD |  | Consumer Sta | 81.62 | -0.03% | -2.64 | -5.41 | 8.29 | 548% | 15.8K |
| BNC |  | Consumer Sta | 5.44 | +0.02% | +0.10 | -3.72 | 1.82 | 291% | 112.6K |
| LNTH | 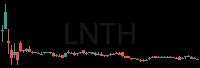 | Health Care | 99.61 | 0.00% | -0.19 | -17.00 | 1.39 | 270% | 717 |
| TSCO | 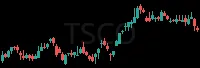 | Consumer Dis | 33.19 | -0.01% | -0.23 | -1.30 | 3.05 | 235% | 0 |
| CBRE |  | Finance | 123.30 | 0.00% | 0.00 | -2.02 | 1.54 | 215% | 0 |
| NUV | 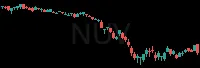 | Finance | 8.26 | 0.00% | +0.03 | 2.93 | 2.90 | 212% | 0 |
| CRBG |  | Finance | 34.13 | 0.00% | 0.00 | 0.19 | 2.12 | 194% | 0 |
| PTCT | 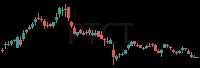 | Health Care | 60.59 | 0.00% | 0.00 | 0.00 | 1.17 | 192% | 1.8K |
| AFRM | 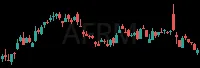 | Finance | 70.45 | +0.01% | +0.37 | 6.11 | 1.10 | 191% | 8.8K |
| ATEC | 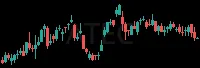 | Health Care | 11.15 | 0.00% | +0.04 | -3.39 | 4.09 | 189% | 7.5K |
| WH |  | Consumer Dis | 72.42 | 0.00% | 0.00 | 2.79 | 2.47 | 184% | 0 |
| AAPL |  | Technology | 343.15 | -0.01% | -4.58 | -5.34 | 4.13 | 180% | 261.8K |
| GNTX |  | Consumer Dis | 20.69 | 0.00% | +0.03 | 14.53 | 1.64 | 171% | 0 |
| ZGN | 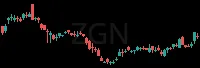 | Consumer Dis | 13.48 | 0.00% | 0.00 | 1.91 | 5.08 | 167% | 0 |
| COCO | 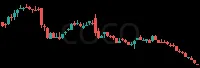 | Consumer Sta | 56.53 | 0.00% | 0.00 | 0.81 | 4.03 | 163% | 0 |
| BLMN |  | Consumer Dis | 9.22 | 0.00% | +0.02 | 1.22 | 4.36 | 158% | 0 |
| NAMS | 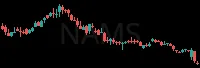 | Health Care | 19.71 | 0.00% | 0.00 | 6.10 | 0.29 | 155% | 0 |
| QXO | 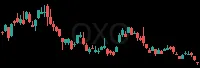 | Consumer Dis | 10.51 | 0.00% | 0.00 | -3.59 | 1.21 | 151% | 17.4K |
| DAN | 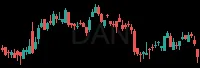 | Consumer Dis | 26.83 | 0.00% | 0.00 | 0.65 | 1.24 | 150% | 0 |
| UTZ |  | Consumer Sta | 14.28 | 0.00% | 0.00 | 0.41 | 2.10 | 141% | 0 |
| ROKU |  | Telecommunic | 158.99 | 0.00% | +0.41 | 18.12 | 5.27 | 140% | 0 |
| HE |  | Utilities | 8.45 | 0.00% | +0.04 | 1.26 | 1.02 | 140% | 0 |
| KNX | 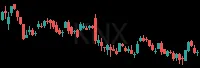 | Industrials | 61.21 | 0.00% | 0.00 | -1.21 | 1.13 | 138% | 0 |
| NAVI | 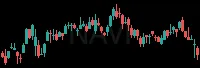 | Finance | 8.46 | -0.01% | -0.04 | 2.81 | 0.92 | 137% | 0 |
| BP |  | Energy | 50.49 | -0.02% | -0.83 | -9.59 | 7.89 | 135% | 61.3K |
| ROL |  | Consumer Dis | 34.78 | 0.00% | -0.04 | -12.77 | 5.85 | 133% | 0 |
| KLRA |  | Health Care | 12.60 | -0.02% | -0.25 | -16.62 | 5.05 | 132% | 0 |
| PYPL |  | Finance | 56.96 | 0.00% | -0.06 | 0.04 | 4.33 | 130% | 13.1K |
| FWRG |  | Consumer Dis | 10.89 | 0.00% | 0.00 | 1.94 | 3.01 | 129% | 0 |
| PUK |  | Finance | 23.70 | 0.00% | 0.00 | 4.31 | 2.83 | 126% | 0 |
| SHAK | 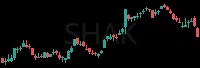 | Consumer Dis | 65.16 | 0.00% | 0.00 | -0.59 | 2.75 | 125% | 0 |
| NAD |  | Finance | 10.32 | 0.00% | -0.01 | -13.56 | 4.51 | 123% | 0 |
| OSCR |  | Health Care | 31.01 | 0.00% | +0.02 | -2.55 | 1.17 | 120% | 4.7K |
| ASST |  | Finance | 28.32 | -0.02% | -0.65 | 1.31 | 2.75 | 120% | 122.8K |
| TEVA | 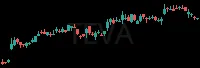 | Health Care | 39.45 | 0.00% | +0.04 | 2.86 | 2.60 | 117% | 12.0K |
| CP | 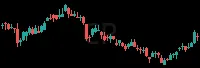 | Industrials | 89.51 | 0.00% | 0.00 | -2.42 | 6.06 | 113% | 0 |
| YUM |  | Consumer Dis | 149.70 | 0.00% | 0.00 | 2.91 | 5.28 | 109% | 0 |
| VVV |  | Industrials | 31.55 | 0.00% | -0.08 | -12.62 | 3.33 | 108% | 0 |
| GPGI | 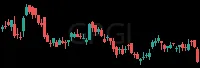 | Finance | 11.30 | 0.00% | -0.04 | -2.57 | 0.09 | 108% | 0 |
| MRNA |  | Health Care | 188.94 | -0.06% | -11.16 | -3.60 | 2.55 | 108% | 115.3K |
| NSC |  | Industrials | 331.00 | 0.00% | +1.01 | 1.15 | 5.30 | 107% | 0 |
| CHD | 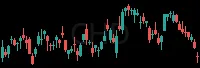 | Consumer Dis | 105.30 | 0.00% | +0.11 | -0.11 | 6.25 | 105% | 0 |
| AS | 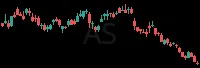 | Consumer Dis | 28.24 | 0.00% | 0.00 | 2.65 | 3.60 | 105% | 0 |
| WRB | 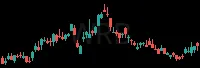 | Finance | 73.33 | 0.00% | 0.00 | 0.13 | 4.59 | 101% | 0 |
| SF | 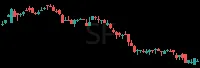 | Finance | 66.68 | 0.00% | 0.00 | -5.41 | 0.74 | 101% | 0 |
| ORLY |  | Consumer Dis | 90.01 | 0.00% | +0.09 | -12.66 | 5.30 | 100% | 0 |
| CNC | 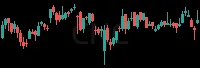 | Health Care | 70.17 | 0.00% | 0.00 | -2.43 | 4.69 | 100% | 0 |
| EFX | 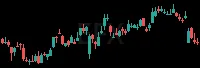 | Finance | 181.50 | 0.00% | -0.86 | -12.00 | 8.67 | 100% | 2.0K |
| BRO | 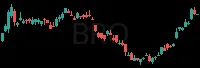 | Finance | 72.90 | 0.00% | -0.07 | -17.72 | 8.05 | 100% | 148 |
| EXLS | 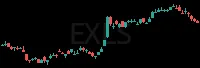 | Consumer Dis | 42.66 | +0.01% | +0.36 | 5.22 | 8.34 | 100% | 417 |
| ACN | 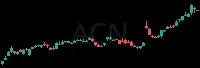 | Consumer Dis | 248.00 | -0.01% | -1.37 | -12.42 | 7.76 | 100% | 2.7K |
| KMB |  | Consumer Dis | 109.54 | -0.01% | -0.61 | -12.42 | 7.51 | 100% | 358 |
| MA |  | Finance | 624.88 | 0.00% | +1.28 | 5.92 | 7.44 | 100% | 684 |
| CSGP | 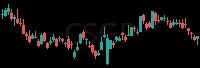 | Finance | 33.97 | 0.00% | +0.05 | 2.30 | 7.15 | 100% | 498 |
| KD | 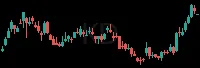 | Technology | 14.54 | -0.01% | -0.22 | -12.42 | 7.39 | 100% | 164 |
| BALL |  | Industrials | 64.56 | 0.00% | -0.20 | 12.57 | 7.19 | 100% | 138 |
| CTSH | 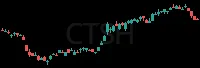 | Technology | 70.68 | 0.00% | +0.14 | 1.70 | 7.33 | 100% | 544 |
| PLNT |  | Consumer Dis | 52.69 | 0.00% | +0.17 | 0.23 | 7.08 | 100% | 159 |
| KBR |  | Industrials | 39.04 | 0.00% | -0.20 | -12.42 | 7.13 | 100% | 120 |
| SHO | 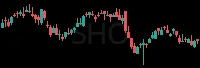 | Consumer Dis | 12.64 | +0.01% | +0.13 | 7.47 | 6.48 | 100% | 791 |
| SONY | 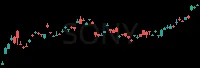 | Consumer Sta | 26.33 | +0.01% | +0.25 | 7.91 | 7.93 | 100% | 3.6K |
| CCEP |  | Consumer Sta | 111.42 | +0.01% | +0.58 | 12.74 | 6.47 | 100% | 473 |
| DOCS |  | Technology | 33.30 | 0.00% | -0.09 | 14.00 | 6.85 | 100% | 1.4K |
| PG | 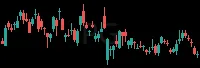 | Consumer Dis | 161.59 | 0.00% | +0.57 | 5.07 | 6.32 | 100% | 3.0K |
| VFC | 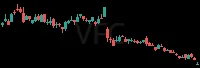 | Industrials | 17.27 | 0.00% | +0.01 | 10.34 | 6.76 | 100% | 1.0K |
| INTU |  | Technology | 343.75 | 0.00% | +0.36 | 5.94 | 5.94 | 100% | 517 |
| Z | 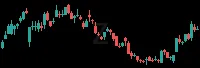 | Consumer Dis | 33.19 | +0.01% | +0.21 | -0.53 | 5.98 | 100% | 2.0K |
| CNI | 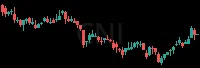 | Industrials | 123.33 | 0.00% | +0.18 | 8.28 | 5.73 | 100% | 482 |
| BBWI |  | Consumer Dis | 20.95 | 0.00% | 0.00 | 1.03 | 5.95 | 100% | 174 |
| AMRZ |  | Industrials | 39.67 | +0.01% | +0.23 | -0.34 | 5.88 | 100% | 1.4K |
| MO |  | Consumer Sta | 74.43 | 0.00% | +0.12 | 1.41 | 5.60 | 100% | 1.4K |
| AEP |  | Utilities | 130.15 | 0.00% | +0.46 | 13.58 | 5.56 | 100% | 322 |
| EXEL | 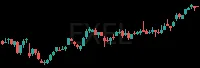 | Health Care | 64.95 | +0.01% | +0.42 | 11.69 | 6.27 | 100% | 306 |
| HRL | 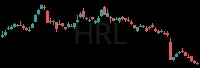 | Consumer Sta | 21.10 | 0.00% | +0.04 | 2.85 | 5.66 | 100% | 215 |
| GO |  | Consumer Sta | 13.51 | +0.02% | +0.21 | 12.41 | 5.20 | 100% | 722 |
| RBLX |  | Technology | 52.70 | 0.00% | -0.19 | -4.84 | 5.21 | 100% | 4.2K |
| DKS |  | Consumer Dis | 144.24 | 0.00% | -0.43 | 11.01 | 5.45 | 100% | 655 |
| CPB |  | Consumer Sta | 20.76 | 0.00% | +0.03 | 10.68 | 5.01 | 100% | 542 |
| HSY |  | Consumer Sta | 170.00 | 0.00% | +0.36 | 6.74 | 4.77 | 100% | 251 |
| GIS | 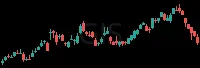 | Consumer Sta | 34.42 | 0.00% | +0.03 | -0.52 | 4.85 | 100% | 1.1K |
| CI |  | Health Care | 306.95 | 0.00% | 0.00 | 13.29 | 6.03 | 100% | 309 |
| LLY |  | Health Care | 1284.20 | +0.01% | +10.74 | 5.51 | 4.46 | 100% | 2.6K |
| FITB | 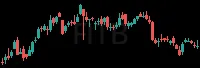 | Finance | 52.51 | -0.01% | -0.47 | -3.02 | 5.00 | 100% | 1.0K |
| PEB |  | Real Estate | 20.55 | +0.01% | +0.16 | 13.13 | 4.58 | 100% | 242 |
| SYRE |  | Health Care | 90.05 | 0.00% | -0.28 | -2.75 | 4.46 | 100% | 2.2K |
| CVS |  | Consumer Sta | 93.68 | 0.00% | +0.21 | 13.58 | 4.82 | 100% | 445 |
| CLX |  | Consumer Dis | 86.52 | 0.00% | +0.12 | 0.45 | 4.25 | 100% | 3.8K |
| PK |  | Consumer Dis | 16.35 | 0.00% | 0.00 | 0.00 | 4.79 | 100% | 299 |
RS = relative strength vs SPY, in ATRs (1 hour / 2 weeks); green leads the market, red lags. RVOL = today's volume vs average. Prices are 15-minute delayed.
New here? How to trade these scans · More Pullbacks+Levels scans: Bullish Pullback - Long · Strong Sector Pullback · VWAP Pullbacks - Long · Bull Flag - Long · SMA Magnet - Long · Near Day High