All scans · Short
Sector Laggards
Open live →ZenBot is a free real-time scanner that surfaces the stocks in play — heavy volume, leading their sector, moving before the crowd. This is one of its built-in scans.
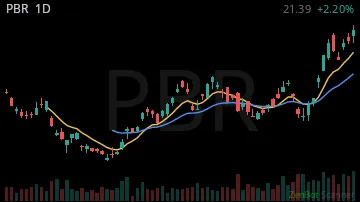
PBR20.50 -0.22%
UGP6.29 -0.19%

BUD81.62 -0.03%

BNC5.44 +0.02%

HE8.45 0.00%

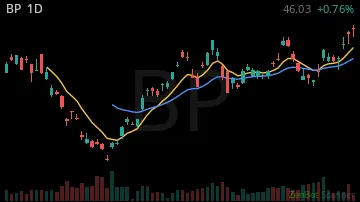
BP50.49 -0.02%
KGS44.31 0.00%

BE193.50 0.00%

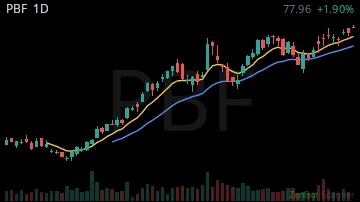
PBF76.00 0.00%
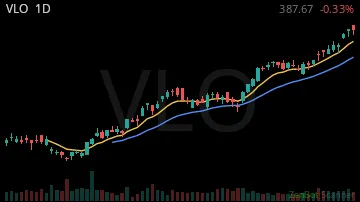
VLO417.25 0.00%
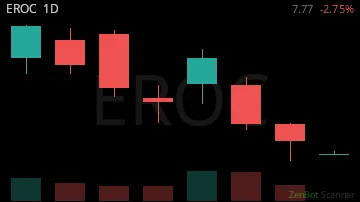
EROC7.77 -0.03%
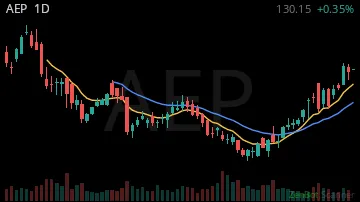
AEP130.15 0.00%
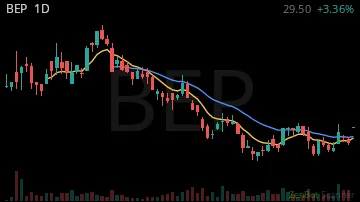
BEP29.50 +0.03%
CWEN31.10 0.00%

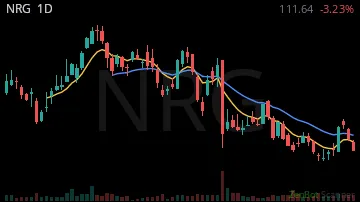
NRG93.00 +0.01%
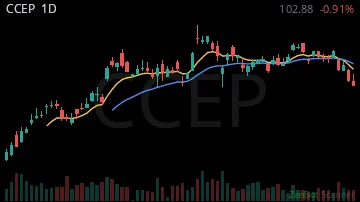
CCEP111.42 +0.01%
CPB20.76 0.00%

CTVA12.45 0.00%

CVS93.68 0.00%

FLO6.15 0.00%

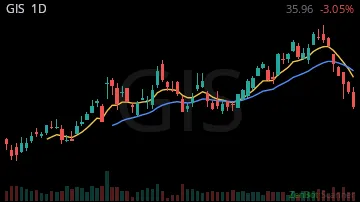
GIS34.42 0.00%
GO13.51 +0.02%

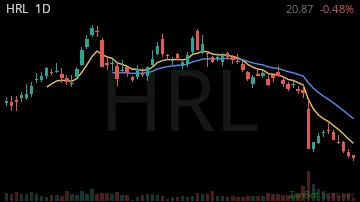
HRL21.10 0.00%
HSY170.00 0.00%

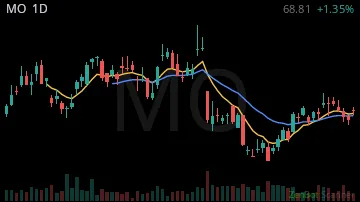
MO74.43 0.00%
SFM66.00 0.00%

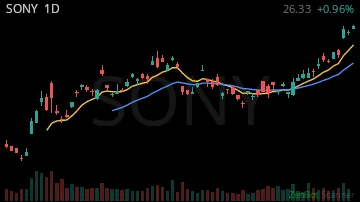
SONY26.33 +0.01%
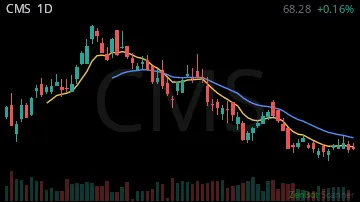
CMS69.55 0.00%
SMPL10.41 0.00%

DG132.40 0.00%

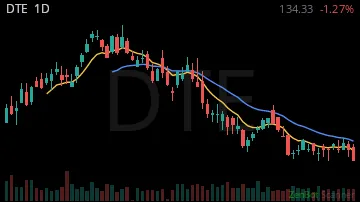
DTE131.17 -0.01%
PRMB19.69 0.00%

KO93.39 +0.01%

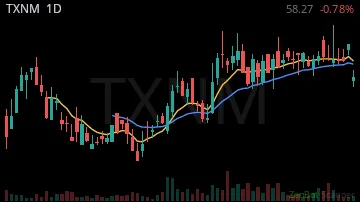
TXNM58.27 0.00%
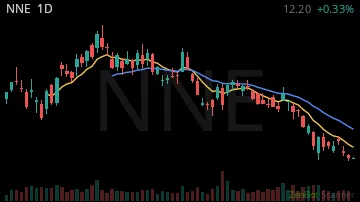
NNE12.16 0.00%
FPS24.40 +0.01%

OKLO26.31 0.00%

FRVO8.09 +0.01%

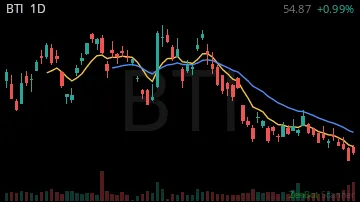
BTI59.40 0.00%
WMT120.36 0.00%

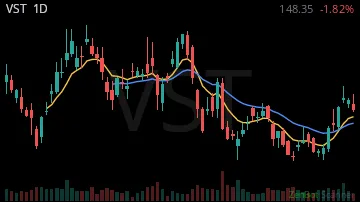
VST140.60 0.00%
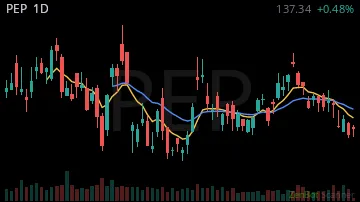
PEP136.49 +0.01%
FCEL11.08 0.00%

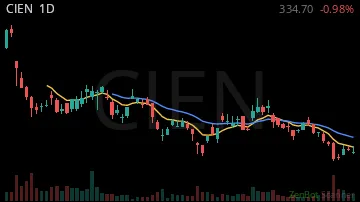
CIEN320.00 0.00%
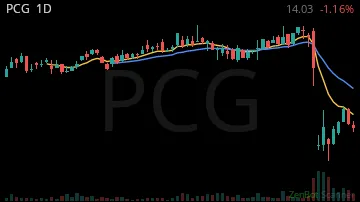
PCG12.63 0.00%
COST1002.01 0.00%

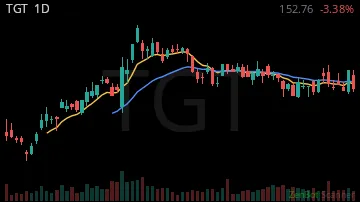
TGT152.66 0.00%
NOMD12.00 0.00%

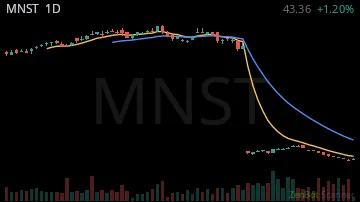
MNST46.59 +0.01%
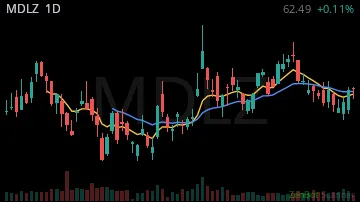
MDLZ63.86 0.00%
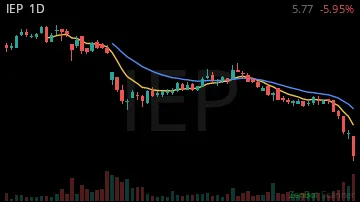
IEP5.76 0.00%
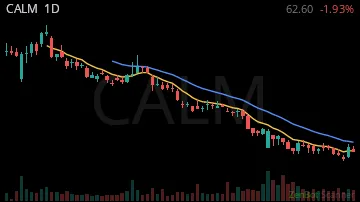
CALM62.60 0.00%
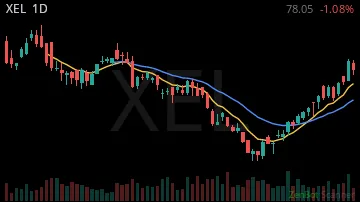
XEL78.05 0.00%
MKC48.19 0.00%

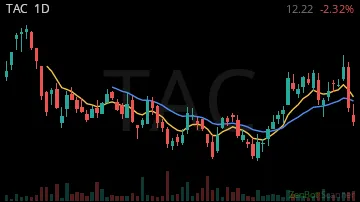
TAC12.22 0.00%
| Symbol | Chart | Sector | Last | Chg % | Chg $ | RS 1H | RS 2W | RVOL | Vol |
|---|---|---|---|---|---|---|---|---|---|
| PBR |  | Energy | 20.50 | -0.22% | -5.66 | -6.05 | 5.33 | 1,296% | 806.1K |
| UGP |  | Utilities | 6.29 | -0.19% | -1.45 | -4.21 | 2.39 | 977% | 24.4K |
| BUD |  | Consumer Sta | 81.62 | -0.03% | -2.64 | -5.41 | 8.29 | 548% | 15.8K |
| BNC |  | Consumer Sta | 5.44 | +0.02% | +0.10 | -3.72 | 1.82 | 291% | 112.6K |
| HE |  | Utilities | 8.45 | 0.00% | +0.04 | 1.26 | 1.02 | 140% | 0 |
| BP |  | Energy | 50.49 | -0.02% | -0.83 | -9.59 | 7.89 | 135% | 61.3K |
| KGS |  | Utilities | 44.31 | 0.00% | 0.00 | -3.48 | -1.76 | 103% | 0 |
| BE |  | Energy | 193.50 | 0.00% | +0.20 | 2.26 | -2.51 | 102% | 240.8K |
| PBF | 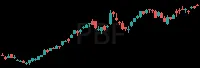 | Energy | 76.00 | 0.00% | -0.17 | 0.58 | 0.84 | 100% | 199 |
| VLO |  | Energy | 417.25 | 0.00% | -2.03 | -0.57 | 2.12 | 100% | 985 |
| EROC |  | Energy | 7.77 | -0.03% | -0.22 | -13.59 | 0.00 | 100% | 3.7K |
| AEP | 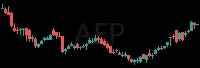 | Utilities | 130.15 | 0.00% | +0.46 | 13.58 | 5.56 | 100% | 322 |
| BEP | 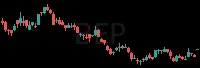 | Utilities | 29.50 | +0.03% | +0.96 | 2.56 | 1.20 | 100% | 158 |
| CWEN |  | Utilities | 31.10 | 0.00% | -0.01 | 13.58 | 3.50 | 100% | 300 |
| NRG |  | Utilities | 93.00 | +0.01% | +0.69 | 13.58 | -0.89 | 100% | 1.6K |
| CCEP |  | Consumer Sta | 111.42 | +0.01% | +0.58 | 12.74 | 6.47 | 100% | 473 |
| CPB |  | Consumer Sta | 20.76 | 0.00% | +0.03 | 10.68 | 5.01 | 100% | 542 |
| CTVA | 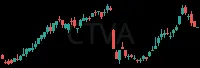 | Consumer Sta | 12.45 | 0.00% | 0.00 | -12.42 | -1.08 | 100% | 220 |
| CVS | 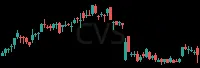 | Consumer Sta | 93.68 | 0.00% | +0.21 | 13.58 | 4.82 | 100% | 445 |
| FLO |  | Consumer Sta | 6.15 | 0.00% | 0.00 | 13.58 | 3.55 | 100% | 499 |
| GIS | 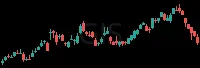 | Consumer Sta | 34.42 | 0.00% | +0.03 | -0.52 | 4.85 | 100% | 1.1K |
| GO |  | Consumer Sta | 13.51 | +0.02% | +0.21 | 12.41 | 5.20 | 100% | 722 |
| HRL | 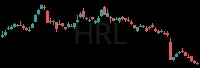 | Consumer Sta | 21.10 | 0.00% | +0.04 | 2.85 | 5.66 | 100% | 215 |
| HSY |  | Consumer Sta | 170.00 | 0.00% | +0.36 | 6.74 | 4.77 | 100% | 251 |
| MO |  | Consumer Sta | 74.43 | 0.00% | +0.12 | 1.41 | 5.60 | 100% | 1.4K |
| SFM |  | Consumer Sta | 66.00 | 0.00% | -0.26 | -8.83 | 2.77 | 100% | 313 |
| SONY | 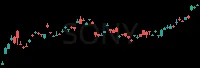 | Consumer Sta | 26.33 | +0.01% | +0.25 | 7.91 | 7.93 | 100% | 3.6K |
| CMS |  | Utilities | 69.55 | 0.00% | -0.03 | -12.62 | 5.97 | 87% | 0 |
| SMPL |  | Consumer Sta | 10.41 | 0.00% | 0.00 | -0.93 | 3.65 | 83% | 0 |
| DG |  | Consumer Sta | 132.40 | 0.00% | -0.29 | -3.97 | 4.79 | 81% | 0 |
| DTE | 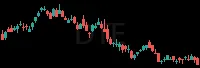 | Utilities | 131.17 | -0.01% | -0.72 | -12.77 | 4.66 | 73% | 0 |
| PRMB |  | Consumer Sta | 19.69 | 0.00% | 0.00 | 0.81 | 3.65 | 72% | 0 |
| KO |  | Consumer Sta | 93.39 | +0.01% | +0.68 | -5.52 | 6.39 | 46% | 17.5K |
| TXNM | 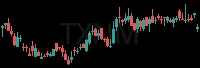 | Utilities | 58.27 | 0.00% | 0.00 | 1.47 | 1.60 | 41% | 0 |
| NNE | 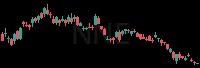 | Utilities | 12.16 | 0.00% | 0.00 | -5.19 | -1.70 | 33% | 1.4K |
| FPS |  | Energy | 24.40 | +0.01% | +0.18 | -0.24 | -3.27 | 33% | 13.4K |
| OKLO | 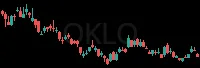 | Utilities | 26.31 | 0.00% | -0.04 | 3.44 | -3.09 | 31% | 34.8K |
| FRVO | 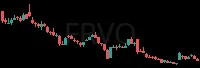 | Utilities | 8.09 | +0.01% | +0.05 | -2.36 | -4.86 | 30% | 3.5K |
| BTI |  | Consumer Sta | 59.40 | 0.00% | -0.08 | -3.26 | 7.11 | 28% | 7.4K |
| WMT | 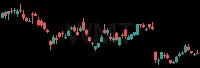 | Consumer Sta | 120.36 | 0.00% | +0.47 | -6.60 | 6.93 | 25% | 9.7K |
| VST | 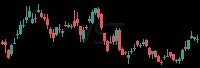 | Utilities | 140.60 | 0.00% | +0.44 | 2.43 | -0.46 | 24% | 14.5K |
| PEP | 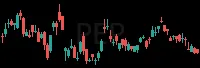 | Consumer Sta | 136.49 | +0.01% | +0.72 | 5.91 | 6.06 | 22% | 4.8K |
| FCEL | 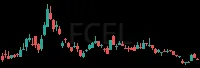 | Energy | 11.08 | 0.00% | -0.03 | 7.92 | -2.83 | 18% | 2.9K |
| CIEN | 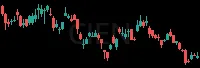 | Utilities | 320.00 | 0.00% | -0.26 | -0.89 | -2.04 | 15% | 1.6K |
| PCG | 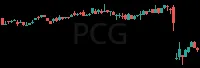 | Utilities | 12.63 | 0.00% | 0.00 | 10.81 | 2.01 | 0% | 463 |
| COST |  | Consumer Sta | 1002.01 | 0.00% | -1.31 | -3.59 | 6.18 | 0% | 566 |
| TGT | 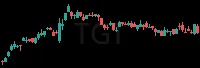 | Consumer Sta | 152.66 | 0.00% | -0.10 | -7.53 | 2.82 | 0% | 328 |
| NOMD |  | Consumer Sta | 12.00 | 0.00% | 0.00 | 1.47 | 5.88 | 0% | 113 |
| MNST |  | Consumer Sta | 46.59 | +0.01% | +0.40 | 11.53 | 5.48 | 0% | 485 |
| MDLZ | 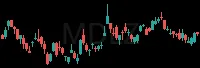 | Consumer Sta | 63.86 | 0.00% | +0.06 | 3.07 | 5.60 | 0% | 374 |
| IEP | 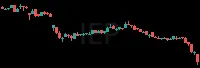 | Energy | 5.76 | 0.00% | -0.01 | -2.35 | -3.26 | 0% | 30 |
| CALM | 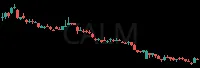 | Consumer Sta | 62.60 | 0.00% | 0.00 | -4.97 | 2.34 | 0% | 29 |
| XEL | 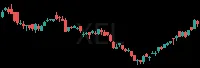 | Utilities | 78.05 | 0.00% | 0.00 | 0.00 | 6.54 | 0% | 34 |
| MKC | 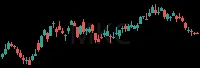 | Consumer Sta | 48.19 | 0.00% | +0.07 | 13.18 | 4.49 | 0% | 9 |
| TAC | 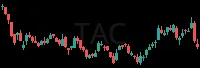 | Utilities | 12.22 | 0.00% | 0.00 | -2.08 | 0.86 | 0% | 1 |
RS = relative strength vs SPY, in ATRs (1 hour / 2 weeks); green leads the market, red lags. RVOL = today's volume vs average. Prices are 15-minute delayed.
New here? How to trade these scans · More Trend scans: Weak Daily · Coiled Spring · Quiet Selling · Turning Down · Breakdown Day · Range Break - Short · Major MA Break - Short · New Lows