All scans · Long
Quiet Buying
Open live →ZenBot is a free real-time scanner that surfaces the stocks in play — heavy volume, leading their sector, moving before the crowd. This is one of its built-in scans.

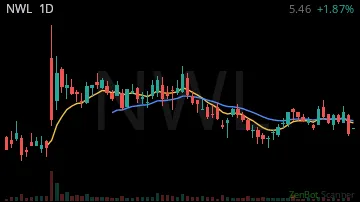

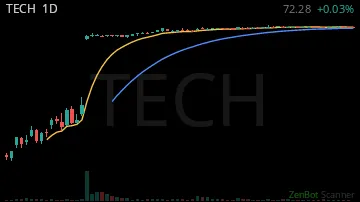


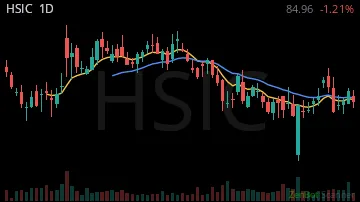
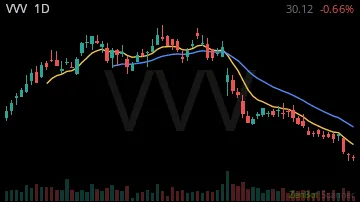
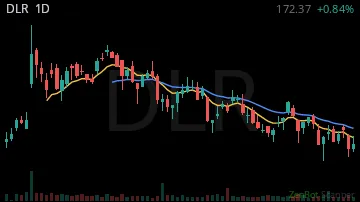

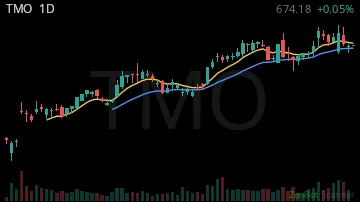
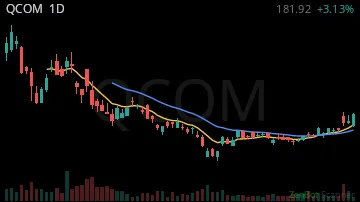
| Symbol | Chart | Sector | Last | Chg % | Chg $ | RS 1H | RS 2W | RVOL | Vol |
|---|---|---|---|---|---|---|---|---|---|
| BWIN |  | Finance | 31.91 | 0.00% | -0.09 | -8.13 | 2.58 | 101,477% | 22.5K |
| NWL | 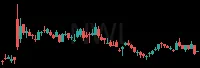 | Industrials | 5.39 | 0.00% | -0.02 | -5.96 | -0.28 | 1,591% | 154.6K |
| SONO |  | Consumer Sta | 17.50 | -0.01% | -0.09 | -8.75 | 2.36 | 1,551% | 16.9K |
| TECH |  | Health Care | 72.64 | 0.00% | -0.05 | 2.66 | 3.16 | 1,474% | 20.2K |
| ARX | 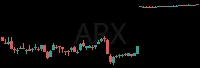 | Finance | 19.82 | 0.00% | 0.00 | 0.53 | 2.32 | 1,128% | 2.4K |
| SRPT | 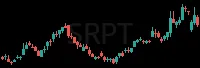 | Health Care | 17.84 | -0.01% | -0.14 | -4.75 | 0.92 | 556% | 31.7K |
| HLMN | 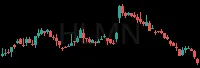 | Consumer Dis | 7.15 | -0.01% | -0.09 | -7.43 | 2.19 | 285% | 8.5K |
| BIRK | 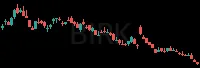 | Consumer Dis | 32.25 | -0.01% | -0.37 | -6.03 | 0.78 | 265% | 8.5K |
| HSIC | 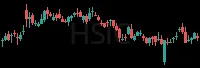 | Health Care | 84.18 | 0.00% | -0.33 | -1.34 | 1.10 | 252% | 6.5K |
| VVV |  | Industrials | 31.78 | -0.01% | -0.17 | 5.51 | 2.29 | 236% | 1.0K |
| DLR | 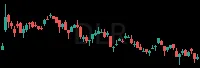 | Real Estate | 177.12 | +0.01% | +2.59 | 7.37 | 0.85 | 188% | 51.6K |
| ARMK |  | Consumer Dis | 54.15 | 0.00% | -0.25 | -6.13 | 0.31 | 173% | 11.4K |
| TMO | 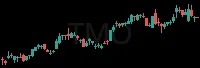 | Industrials | 683.44 | 0.00% | -1.45 | -1.22 | 2.77 | 152% | 29.0K |
| QCOM | 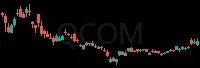 | Technology | 181.95 | +0.01% | +2.35 | 2.34 | 1.75 | 131% | 561.7K |
RS = relative strength vs SPY, in ATRs (1 hour / 2 weeks); green leads the market, red lags. RVOL = today's volume vs average. Prices are 15-minute delayed.
New here? How to trade these scans · More Trend scans: Strong Daily · Daily Trade Signal · Sector Leaders · All Clear · Coiled Spring · Turning Up · Breakout Day · Range Break - Long · Major MA Break - Long · New Highs · 90-Day Leaders