All scans · Long
Daily Trade Signal
Open live →ZenBot is a free real-time scanner that surfaces the stocks in play — heavy volume, leading their sector, moving before the crowd. This is one of its built-in scans.
AMX24.24 -0.01%

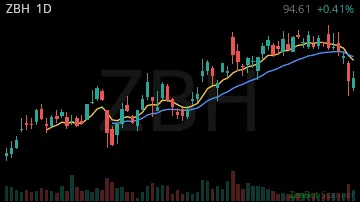
ZBH98.91 0.00%
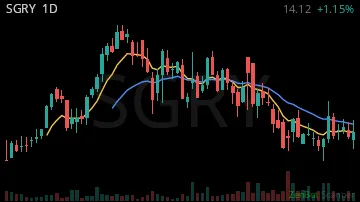
SGRY19.45 +0.23%
SHOT9.88 0.00%
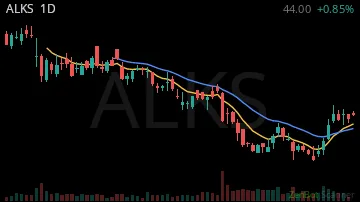
ALKS44.00 +0.01%
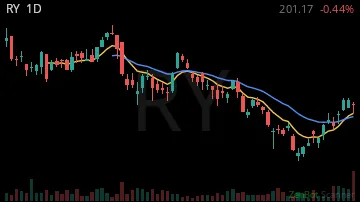
RY201.17 0.00%
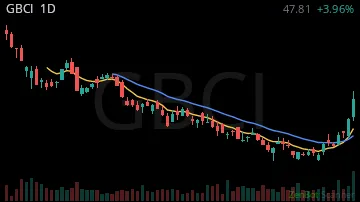
GBCI47.81 0.00%
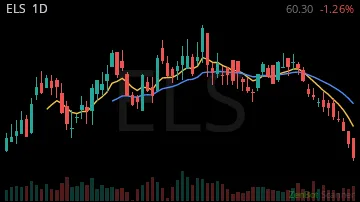
ELS60.84 0.00%
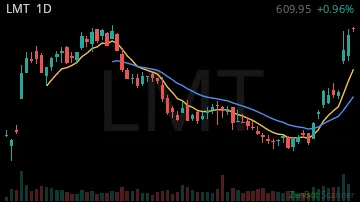
LMT609.10 +0.01%
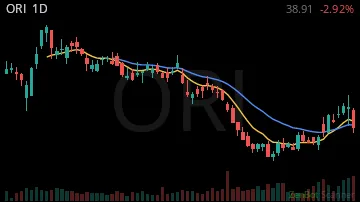
ORI38.91 0.00%
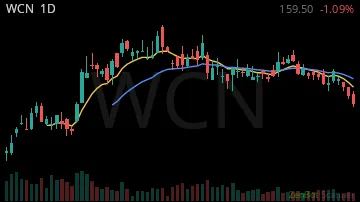
WCN186.31 0.00%
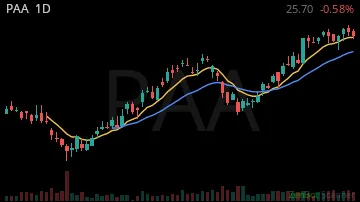
PAA26.70 0.00%
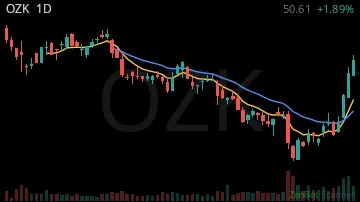
OZK50.61 0.00%
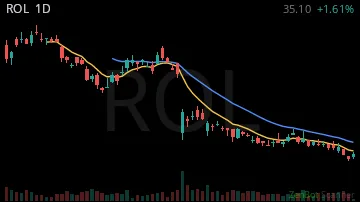
ROL34.78 0.00%
KLRA12.60 -0.02%

PRU115.97 +0.01%

LADR9.31 0.00%

TRU80.07 -0.02%

PAGP28.90 +0.01%

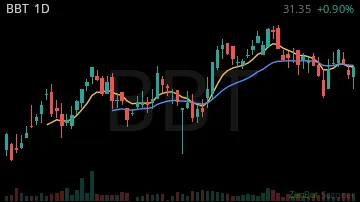
BBT30.07 0.00%
CDW165.11 0.00%

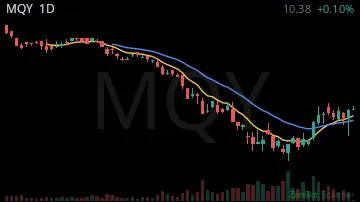
MQY10.26 0.00%
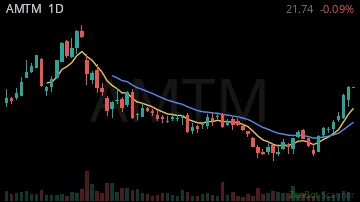
AMTM21.74 0.00%
BBY100.30 0.00%

CPB20.76 0.00%

EFX181.50 0.00%
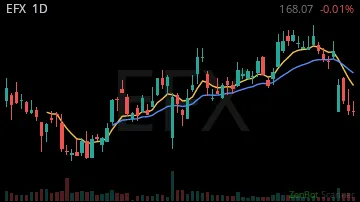
GIS34.42 0.00%
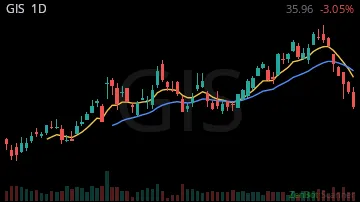
MPLX59.04 0.00%

RPRX63.78 0.00%
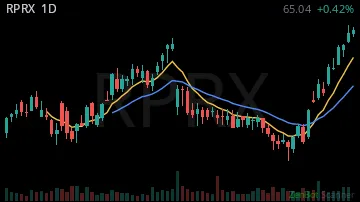
TAK20.55 +0.02%
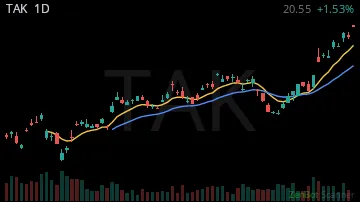
TU8.83 0.00%

UPS101.25 0.00%

VIST74.31 -0.01%

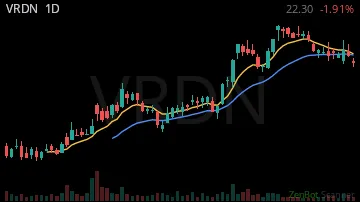
VRDN22.05 -0.01%
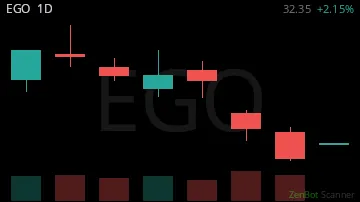
EGO32.35 +0.02%
USO164.79 -0.03%

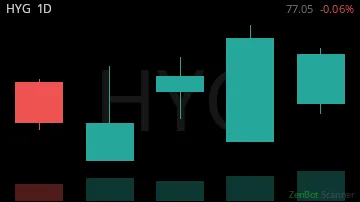
HYG77.00 0.00%
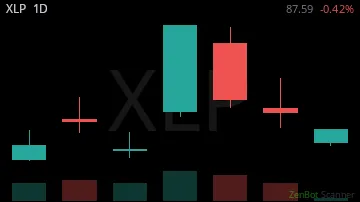
XLP88.65 0.00%
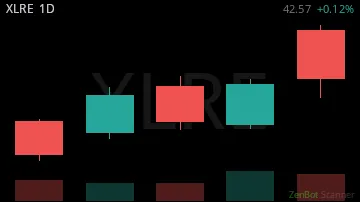
XLRE42.58 0.00%
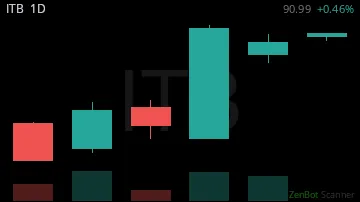
ITB90.99 0.00%
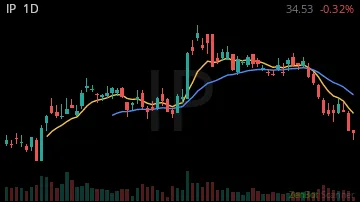
IP33.19 0.00%
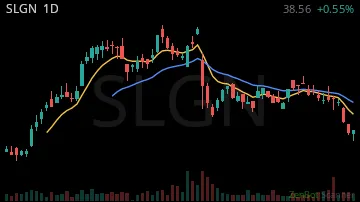
SLGN39.30 0.00%
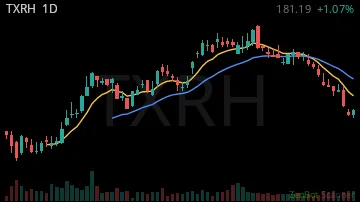
TXRH165.66 0.00%
AQN5.41 0.00%

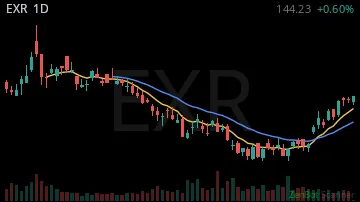
EXR143.41 0.00%
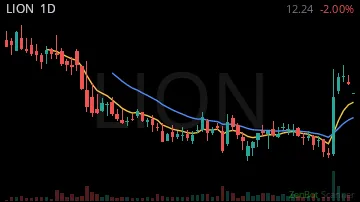
LION12.24 -0.02%
YELP19.99 0.00%

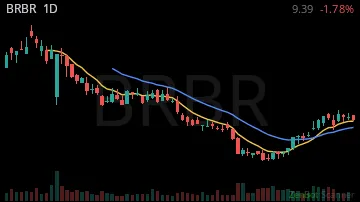
BRBR9.32 -0.02%
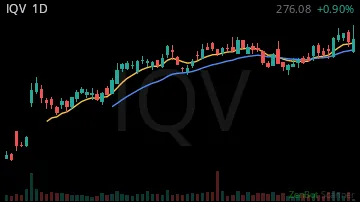
IQV279.36 0.00%
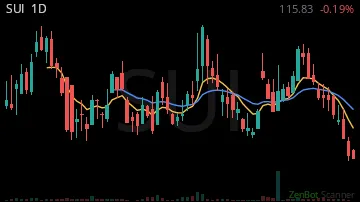
SUI120.24 0.00%
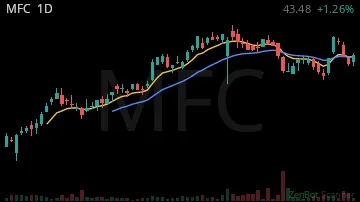
MFC44.26 0.00%
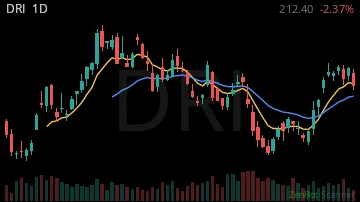
DRI212.40 0.00%
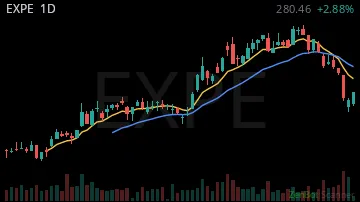
EXPE297.00 +0.03%
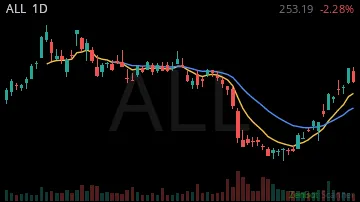
ALL253.19 0.00%
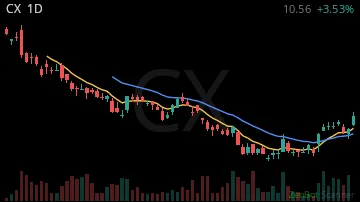
CX10.40 +0.02%
MCD249.52 0.00%

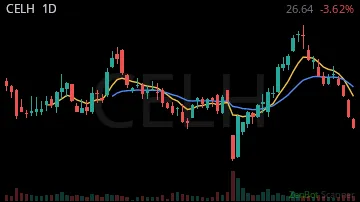
CELH28.41 0.00%
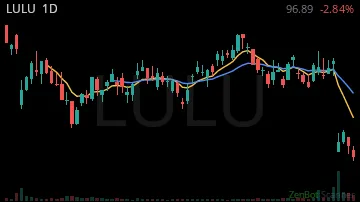
LULU99.15 0.00%
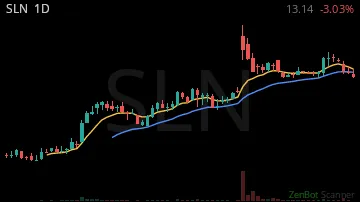
SLN19.63 0.00%
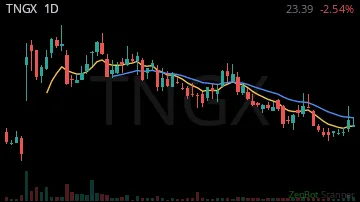
TNGX23.35 0.00%
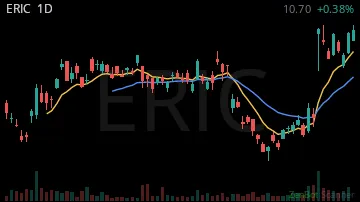
ERIC10.72 +0.01%
MNDY106.50 0.00%

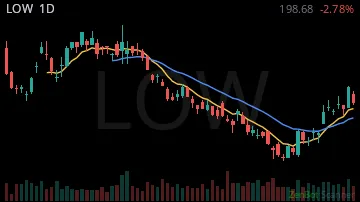
LOW198.68 0.00%
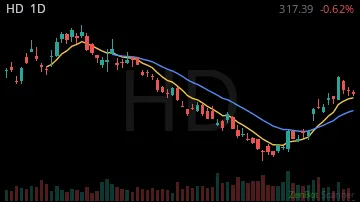
HD319.59 0.00%
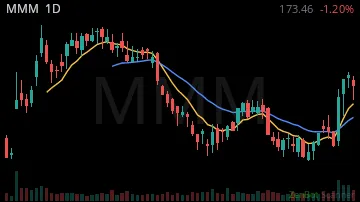
MMM173.16 0.00%
ALKT16.00 0.00%

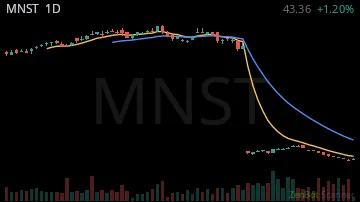
MNST46.59 +0.01%
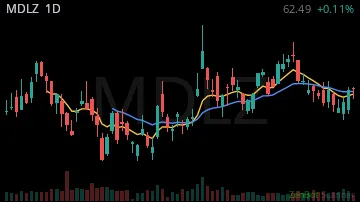
MDLZ63.86 0.00%
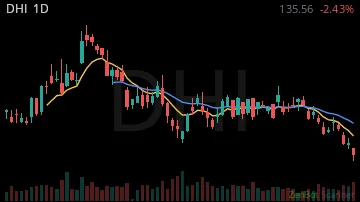
DHI147.35 0.00%
PAYX118.40 0.00%

CPRT29.04 0.00%

D65.04 0.00%

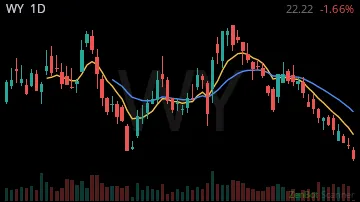
WY19.49 0.00%
NRIX25.34 0.00%

SJM129.98 0.00%

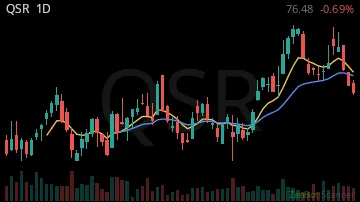
QSR75.34 0.00%
| Symbol | Chart | Sector | Last | Chg % | Chg $ | RS 1H | RS 2W | RVOL | Vol |
|---|---|---|---|---|---|---|---|---|---|
| AMX | 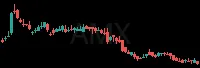 | Telecommunic | 24.24 | -0.01% | -0.33 | -14.65 | 5.91 | 4,711% | 2.6K |
| ZBH | 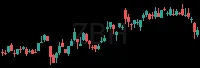 | Health Care | 98.91 | 0.00% | +0.35 | 1.68 | 6.73 | 4,643% | 729 |
| SGRY | 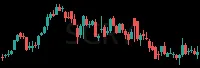 | Health Care | 19.45 | +0.23% | +3.70 | 0.50 | 5.97 | 3,461% | 10.2K |
| SHOT |  | 9.88 | 0.00% | 0.00 | 14.33 | 15.02 | 2,951% | 0 | |
| ALKS | 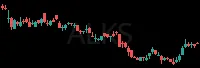 | Health Care | 44.00 | +0.01% | +0.37 | -4.95 | 3.86 | 1,575% | 2.3K |
| RY | 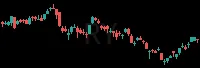 | Finance | 201.17 | 0.00% | 0.00 | 0.10 | 5.88 | 346% | 0 |
| GBCI | 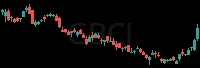 | Finance | 47.81 | 0.00% | 0.00 | -1.72 | 7.49 | 247% | 0 |
| ELS | 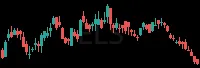 | Real Estate | 60.84 | 0.00% | 0.00 | 5.81 | 4.27 | 230% | 0 |
| LMT | 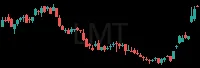 | Industrials | 609.10 | +0.01% | +4.92 | -1.68 | 8.48 | 207% | 6.2K |
| ORI | 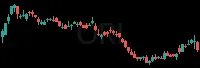 | Finance | 38.91 | 0.00% | 0.00 | 1.89 | 3.80 | 207% | 0 |
| WCN | 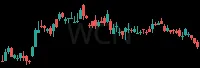 | Utilities | 186.31 | 0.00% | -0.29 | 1.94 | 8.91 | 171% | 0 |
| PAA |  | Energy | 26.70 | 0.00% | +0.07 | -12.77 | 7.84 | 150% | 0 |
| OZK |  | Finance | 50.61 | 0.00% | 0.00 | -6.16 | 7.99 | 146% | 0 |
| ROL |  | Consumer Dis | 34.78 | 0.00% | -0.04 | -12.77 | 5.85 | 133% | 0 |
| KLRA |  | Health Care | 12.60 | -0.02% | -0.25 | -16.62 | 5.05 | 132% | 0 |
| PRU |  | Finance | 115.97 | +0.01% | +0.98 | 4.09 | 3.45 | 126% | 0 |
| LADR |  | Real Estate | 9.31 | 0.00% | 0.00 | 1.48 | 4.97 | 121% | 0 |
| TRU |  | Finance | 80.07 | -0.02% | -1.41 | -5.02 | 8.00 | 113% | 0 |
| PAGP |  | Energy | 28.90 | +0.01% | +0.30 | 13.23 | 7.43 | 111% | 0 |
| BBT | 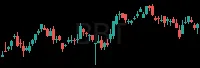 | Finance | 30.07 | 0.00% | 0.00 | 3.07 | 6.36 | 107% | 0 |
| CDW |  | Consumer Dis | 165.11 | 0.00% | 0.00 | 1.54 | 7.71 | 106% | 0 |
| MQY |  | Finance | 10.26 | 0.00% | 0.00 | 1.80 | 5.05 | 100% | 0 |
| AMTM | 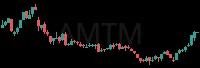 | Consumer Dis | 21.74 | 0.00% | -0.02 | 11.73 | 6.93 | 100% | 3.1K |
| BBY | 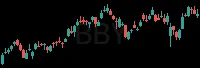 | Consumer Dis | 100.30 | 0.00% | +0.43 | 14.00 | 7.18 | 100% | 177 |
| CPB |  | Consumer Sta | 20.76 | 0.00% | +0.03 | 10.68 | 5.01 | 100% | 542 |
| EFX |  | Finance | 181.50 | 0.00% | -0.86 | -12.00 | 8.67 | 100% | 2.0K |
| GIS | 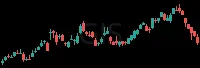 | Consumer Sta | 34.42 | 0.00% | +0.03 | -0.52 | 4.85 | 100% | 1.1K |
| MPLX |  | Energy | 59.04 | 0.00% | -0.09 | -14.14 | 4.52 | 100% | 0 |
| RPRX | 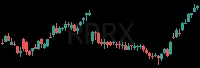 | Health Care | 63.78 | 0.00% | -0.08 | -1.28 | 7.31 | 100% | 322 |
| TAK |  | Health Care | 20.55 | +0.02% | +0.31 | 6.79 | 7.54 | 100% | 1.1K |
| TU | 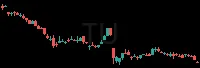 | Telecommunic | 8.83 | 0.00% | 0.00 | -1.78 | 6.13 | 100% | 857 |
| UPS |  | Industrials | 101.25 | 0.00% | +0.19 | 9.40 | 6.68 | 100% | 985 |
| VIST |  | Energy | 74.31 | -0.01% | -0.53 | -8.71 | 6.08 | 100% | 743 |
| VRDN |  | Health Care | 22.05 | -0.01% | -0.32 | 7.99 | 6.49 | 100% | 543 |
| EGO |  | Basic Materi | 32.35 | +0.02% | +0.68 | 9.85 | 3.46 | 100% | 24.9K |
| USO |  | 164.79 | -0.03% | -4.74 | -6.79 | 12.68 | 100% | 111.8K | |
| HYG |  | 77.00 | 0.00% | -0.05 | -2.55 | 10.06 | 100% | 0 | |
| XLP |  | 88.65 | 0.00% | +0.39 | -1.02 | 10.54 | 100% | 6.3K | |
| XLRE |  | 42.58 | 0.00% | +0.01 | 1.34 | 9.14 | 100% | 0 | |
| ITB |  | 90.99 | 0.00% | +0.42 | 2.53 | 8.30 | 100% | 873 | |
| IP |  | Basic Materi | 33.19 | 0.00% | 0.00 | 2.34 | 3.87 | 94% | 0 |
| SLGN |  | Industrials | 39.30 | 0.00% | 0.00 | -0.86 | 5.92 | 93% | 0 |
| TXRH |  | Consumer Dis | 165.66 | 0.00% | 0.00 | 2.26 | 3.09 | 90% | 0 |
| AQN |  | Utilities | 5.41 | 0.00% | 0.00 | -0.75 | 5.88 | 87% | 0 |
| EXR |  | Real Estate | 143.41 | 0.00% | 0.00 | 1.94 | 6.78 | 86% | 0 |
| LION | 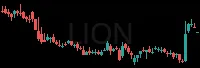 | Consumer Dis | 12.24 | -0.02% | -0.25 | -16.57 | 4.78 | 83% | 200 |
| YELP |  | Consumer Dis | 19.99 | 0.00% | 0.00 | 2.44 | 4.05 | 77% | 0 |
| BRBR | 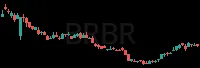 | Consumer Sta | 9.32 | -0.02% | -0.23 | -12.82 | 5.96 | 76% | 0 |
| IQV |  | Health Care | 279.36 | 0.00% | 0.00 | 1.83 | 5.18 | 67% | 0 |
| SUI | 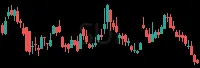 | Real Estate | 120.24 | 0.00% | 0.00 | 3.06 | 6.17 | 64% | 0 |
| MFC |  | Finance | 44.26 | 0.00% | 0.00 | -1.98 | 5.65 | 63% | 0 |
| DRI |  | Consumer Dis | 212.40 | 0.00% | 0.00 | 3.14 | 4.67 | 60% | 0 |
| EXPE | 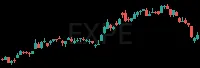 | Consumer Dis | 297.00 | +0.03% | +7.99 | 13.26 | 4.89 | 58% | 0 |
| ALL | 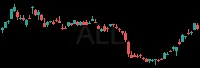 | Finance | 253.19 | 0.00% | 0.00 | -0.08 | 7.42 | 55% | 0 |
| CX | 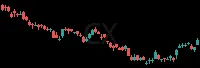 | Industrials | 10.40 | +0.02% | +0.20 | 7.57 | 4.67 | 52% | 313 |
| MCD | 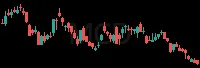 | Consumer Dis | 249.52 | 0.00% | +1.06 | -5.30 | 6.18 | 33% | 7.9K |
| CELH | 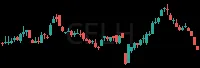 | Consumer Sta | 28.41 | 0.00% | -0.06 | -7.92 | 3.73 | 26% | 3.0K |
| LULU |  | Consumer Dis | 99.15 | 0.00% | +0.14 | 9.00 | 4.25 | 18% | 1.7K |
| SLN |  | Health Care | 19.63 | 0.00% | -0.04 | -4.66 | 9.97 | 9% | 381 |
| TNGX | 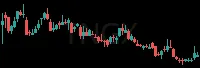 | Health Care | 23.35 | 0.00% | +0.01 | -17.04 | 3.16 | 1% | 1.5K |
| ERIC | 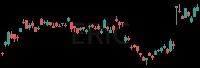 | Technology | 10.72 | +0.01% | +0.06 | 8.65 | 6.37 | 0% | 2.4K |
| MNDY |  | Technology | 106.50 | 0.00% | -0.03 | -0.59 | 6.58 | 0% | 270 |
| LOW | 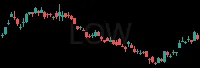 | Consumer Dis | 198.68 | 0.00% | 0.00 | -2.19 | 5.63 | 0% | 281 |
| HD | 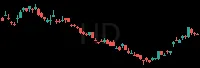 | Consumer Dis | 319.59 | 0.00% | -0.24 | 1.04 | 6.83 | 0% | 358 |
| MMM | 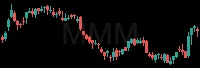 | Health Care | 173.16 | 0.00% | -0.30 | 4.25 | 5.04 | 0% | 234 |
| ALKT |  | Technology | 16.00 | 0.00% | -0.03 | -0.70 | 5.75 | 0% | 129 |
| MNST |  | Consumer Sta | 46.59 | +0.01% | +0.40 | 11.53 | 5.48 | 0% | 485 |
| MDLZ |  | Consumer Sta | 63.86 | 0.00% | +0.06 | 3.07 | 5.60 | 0% | 374 |
| DHI | 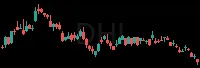 | Consumer Dis | 147.35 | 0.00% | -0.13 | -14.26 | 5.83 | 0% | 112 |
| PAYX |  | Industrials | 118.40 | 0.00% | +0.36 | 4.96 | 8.55 | 0% | 102 |
| CPRT |  | Consumer Dis | 29.04 | 0.00% | +0.04 | 3.07 | 5.00 | 0% | 162 |
| D | 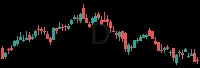 | Utilities | 65.04 | 0.00% | -0.16 | 2.38 | 5.31 | 0% | 49 |
| WY |  | Real Estate | 19.49 | 0.00% | 0.00 | -1.23 | 4.13 | 0% | 67 |
| NRIX |  | Health Care | 25.34 | 0.00% | 0.00 | 3.86 | 4.49 | 0% | 12 |
| SJM |  | Consumer Sta | 129.98 | 0.00% | 0.00 | 1.47 | 6.89 | 0% | 7 |
| QSR | 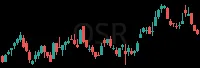 | Consumer Dis | 75.34 | 0.00% | 0.00 | 2.88 | 6.21 | 0% | 6 |
RS = relative strength vs SPY, in ATRs (1 hour / 2 weeks); green leads the market, red lags. RVOL = today's volume vs average. Prices are 15-minute delayed.
New here? How to trade these scans · More Trend scans: Strong Daily · Sector Leaders · All Clear · Coiled Spring · Quiet Buying · Turning Up · Breakout Day · Range Break - Long · Major MA Break - Long · New Highs · 90-Day Leaders